A minimum income standard for the UK in 2013
This year's updated figures show a continuing squeeze on incomes relative to rising costs, only partly alleviated by increased tax allowances.
What income do people need to achieve a socially acceptable standard of living in 2013?
This year's updated figures show a continuing squeeze on incomes relative to rising costs, only partly alleviated by increased tax allowances.
Updated annually, MIS shows us the cost of items and activities the public think we all need for a decent standard of living. It also calculates the earnings required to enable different household types to achieve this living standard.
- Single people need to earn at least £16,850 a year before tax in 2013 for a minimum acceptable living standard. Couples with two children need to earn at least £19,400 each.
- The cost of the 'minimum' household budget of goods and services required for a decent standard of living is rising faster than the official rate of inflation.
- Over the past five years, working-age benefits have deteriorated substantially relative to MIS. Out-of-work benefits remain well below MIS, but pensioners claiming Pension Credit receive incomes close to minimum requirements.
- The jump in the personal tax allowance in April 2013 has slightly eased cost-of-living squeeze for those earning enough to claim it. But the benefits have been outweighed by cuts to tax credits and the rising cost of essentials.
- Families with children are particularly feeling the squeeze. Earnings needed to make ends meet have risen by over 5 per cent, at a time when average earnings have been flat.
Summary
Key points
- Single people need to earn at least £16,850 a year before tax in 2013 for a minimum acceptable living standard. Couples with two children need to earn at least £19,400 each.
- Through inflation, the 'minimum' household budget of goods and services rose by around 4 per cent in the year to April 2013, compared with 2.4 per cent on the Government’s measure, the Consumer Prices Index (CPI). Over the past decade, minimum household budgets have risen by 45 per cent, against the CPI's 30 per cent.
- Out-of-work benefits remain well below the MIS level, but pensioners claiming Pension Credit receive incomes close to minimum requirements. Over the past five years, working-age benefits have deteriorated substantially relative to MIS.
- The jump in the personal tax allowance in April 2013 has slightly eased cost-of-living squeezes for single people earning enough to claim it. Even though they need to spend over 4 per cent more than in 2012 for a minimum budget, the earnings required for this have risen by under 3 per cent.
- The picture is less positive for families with children. Earnings needed to make ends meet have risen by over 5 per cent. Higher tax allowances have been offset by Child Benefit freezes and below-inflation tax credit rises. In recent years, families' earnings needed to achieve MIS have been rising rapidly, while actual wages have stagnated.
Background
How much do people need to achieve an acceptable living standard in the UK?
This question is crucial when rising prices and stagnant incomes are creating unprecedented erosion of household living standards.
Since 2008, JRF has published annual updates of the minimum income standard (MIS) for the UK, to reflect changes in costs and living standards. The standard is based on asking members of the public to identify the items and services a household would require to reach a minimum acceptable standard of living, covering essential needs and allowing household members to participate in society. MIS is a unique way to assess at what point tougher times prevent households from living at a socially acceptable level. New research on minimum baskets is carried out every two years, but in 2013 the MIS update was based on inflation and changes in tax and benefit entitlements.
How inflation affects minimum budgets
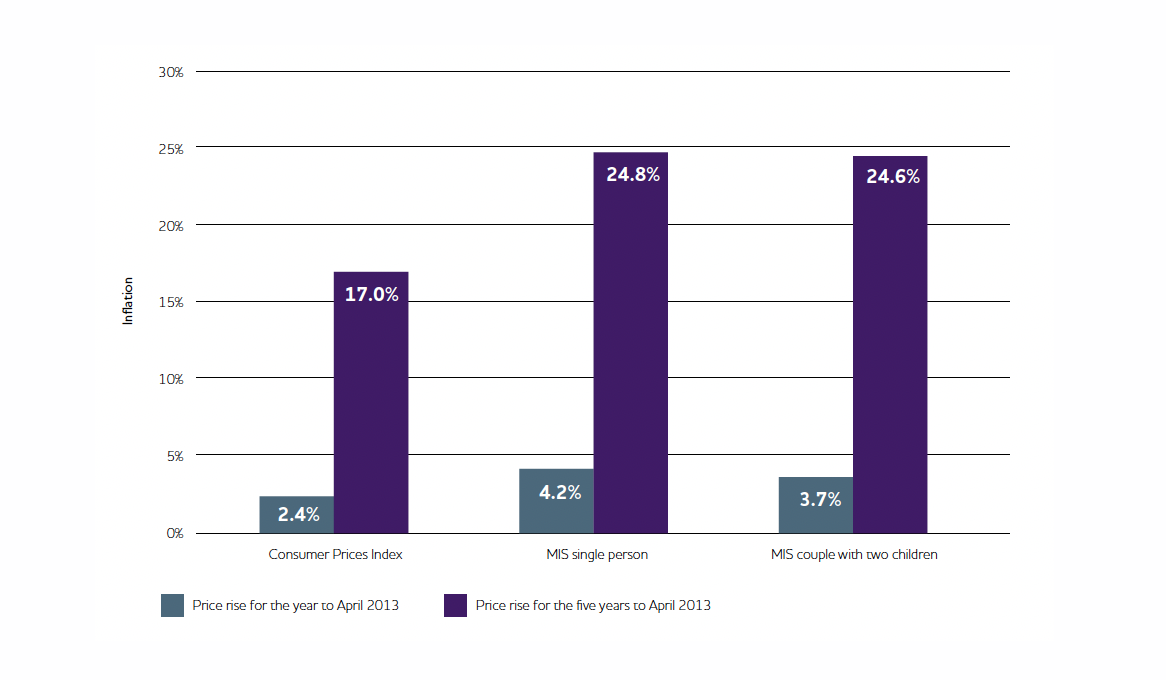
In the year to April 2013, the cost of minimum budgets for various households rose by between 3.3 and 4.2 per cent. This was more than the Government’s preferred inflation measure, the Consumer Prices Index (CPI), which rose by 2.4 per cent. Since the launch of MIS five years ago, the cost of the basket of essential goods and services has risen by nearly 25 per cent, compared with 17 per cent for CPI (see Figure 1). Over ten years, the minimum basket has become 45 per cent more expensive, compared with a 30 per cent increase in CPI. Recent higher-than-average increases in the cost of items such as food and public transport, which are more strongly represented in MIS budgets than in the CPI, account for these differences. Rapidly rising social rents and childcare fees have also contributed to increases in the minimum cost of living.
Figure 1: Inflation over one year and over five years to April 2013 (click for a larger version)
The rising cost of achieving a minimum living standard is compounded by household incomes increasing more slowly than CPI. Average earnings have barely changed over the past year, rising only 0.4 per cent between the first quarters of 2012 and 2013. Working-age benefits and tax credits, which until now were mostly linked to CPI, rose in general by only 1 per cent to April 2013 (and Child Benefit remains frozen). In short, minimum spending requirements have risen by around 4 per cent, but wages and benefits by only 1 per cent or less.
Minimum budgets, April 2013
Table 1 shows revised MIS budgets for April 2013, alongside key comparisons (click for a larger version):
| Family type | Single working-age person | Pensioner couple | Couple + 2 children | Lone parent + 1 child |
|---|---|---|---|---|
| Weekly budget excluding rent/childcare | £200.64 | £241.25 | £471.16 | £284.57 |
| % inflation rise since 2012 (CPI = 2.4%) | 4.2% | 4.2% | 3.7% | 3.3% |
| Annual earnings requirement (adults working full time) | £16,852 | N/A | £38,759 | £25,586 |
| Disposable income as % of MIS on minimum wage* | 72% | N/A | 84% | 87% |
| Disposable income as % of MIS on Income Support/Pension Credit* | 38% | 101% | 58% | 57% |
* After council tax, rent and any childcare costs
For non-working families of working age, benefits provide too little to reach an acceptable living standard as defined by MIS. Benefits provide enough for pensioners if those on low incomes claim Pension Credit. Adequacy of benefits has declined substantially in the past five years, especially for lone parents, who can now afford only 57 per cent of MIS, compared with 68 per cent in 2008.
For most households in work, pay rates required to reach MIS remain well above the National Minimum Wage, currently £6.19 an hour, equivalent to just over £12,000 a year for someone in fulltime work. A single person now needs to earn £16,850 a year before tax to reach an adequate living standard as defined by MIS. Families with children, helped by tax credits, get closer to MIS on low wages than single people. However, since tax credits are withdrawn rapidly as earnings rise, working families with children need higher earnings to raise their incomes to the minimum level, compared with households without children.
Changes in income tax and tax credits affect how much households need to earn to reach what the public think is an adequate living standard. For all working households, the large increase in personal tax allowance in 2013 has lowered this amount. However, this gain is offset by the above-inflation rise in the cost of a minimum basket and, for families with children, by a real-terms cut in tax credits. A single person needs to earn 2.9 per cent more than a year ago to make ends meet, while a couple with two children need 5.5 per cent more.
Conclusion
The squeeze in living standards caused by the combination of rising prices and stagnant incomes continues to hit people on low incomes hard. Over the past five years, the spending needed to reach an acceptable living standard according to MIS has risen by a quarter or more for various households, while earnings have hardly risen at all. During this period, real-terms cuts in benefits and tax credits have exacerbated the squeeze. This has been offset to only a small degree by increases in tax allowances enabling households to keep more of what they earn. Families with children have had the greatest setbacks in terms of earning enough to make ends meet, since they rely most on the state support that is now being cut back.