London, the North of England, and Scotland hit hardest by the crisis of spiralling prices
Joseph Elliott explores how the cost of living crisis is playing out across the country, and how the Government must do more to help families facing an impossible autumn and winter.
- Written by:
-
Joseph Elliott
- Date published:

Between 24 May and 7 June 2022 we asked over 4,000 people on low-incomes (in the bottom 40% of national household incomes) across the UK how they were managing during the cost-of-living crisis. This blog explores the geographic story and drivers behind the differences in outcomes for low-income households across UK nations and regions.
Our analysis finds low-income Londoners are faring worst in the cost of living crisis, followed by people in Scotland, the North and Midlands of England and Northern Ireland. Geographic differences are explained by the proportions of people in different areas on inadequate incomes, with a lack of savings, paying high housing costs (relative to incomes) and living in energy inefficient homes in colder parts of the country. What is clear from our analysis is that some groups are disproportionately exposed to spiralling energy prices, household bills and grocery receipts, but that across the whole country huge numbers of people are experiencing unprecedented levels of hardship. The Government must do more to help families facing an impossible winter.
Low-income Londoners are at the highest risk of experiencing hardship and deprivation
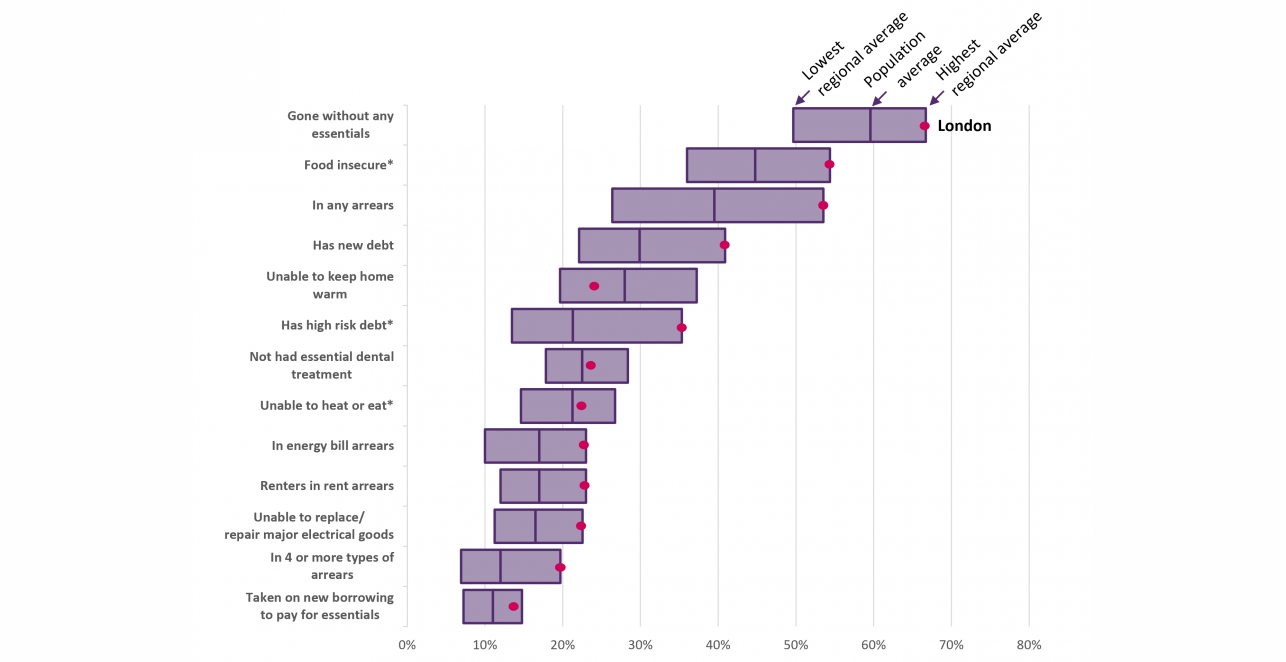
Despite its incredible wealth and high average incomes (recent data puts London mean average earnings at 46% higher than the national average - ONS), London has the highest intraregional income and wealth inequalities of any part of the UK, and the highest poverty rate of anywhere in the UK (27%). While wealthier Londoners may be better equipped to manage rising prices, our new analysis finds that Londoners on lower incomes are most likely to be struggling with spiralling prices of energy, food and services. In our recent survey, London consistently had the highest proportion of low-income households experiencing hardship including going without essentials, experiencing food insecurity, in arrears with any bills or outgoings, and taking out new debt since the start of the year.
Graph 1: The cost-of-living crisis is hitting low-income households in London hardest
Low-income households in Scotland, the North and Midlands of England were more likely to be going without essentials and experiencing hardship than average
After London, low-income households in Scotland, the North and Midlands of England were more likely than average to report going without essentials, being food insecure, being in arrears and having taken on new debts. More than a quarter of low-income households in Scotland (27%) were both unable to heat their home and were facing food insecurity, the highest of any UK nation and region, and households in the North of England were also disproportionately likely to be in this position.
What makes this more worrying is that the cohort of low-income households make up a larger share of households in the North and Midlands of England; just under half (46%) of people in the North of England are on the bottom 40% of national incomes, compared to three in ten in the South East and a third (34%) in London. As such, not only are low-income households in these areas more likely to report being behind on bills and to be going without essentials than average, but they also make up a larger share of the overall population in these areas.
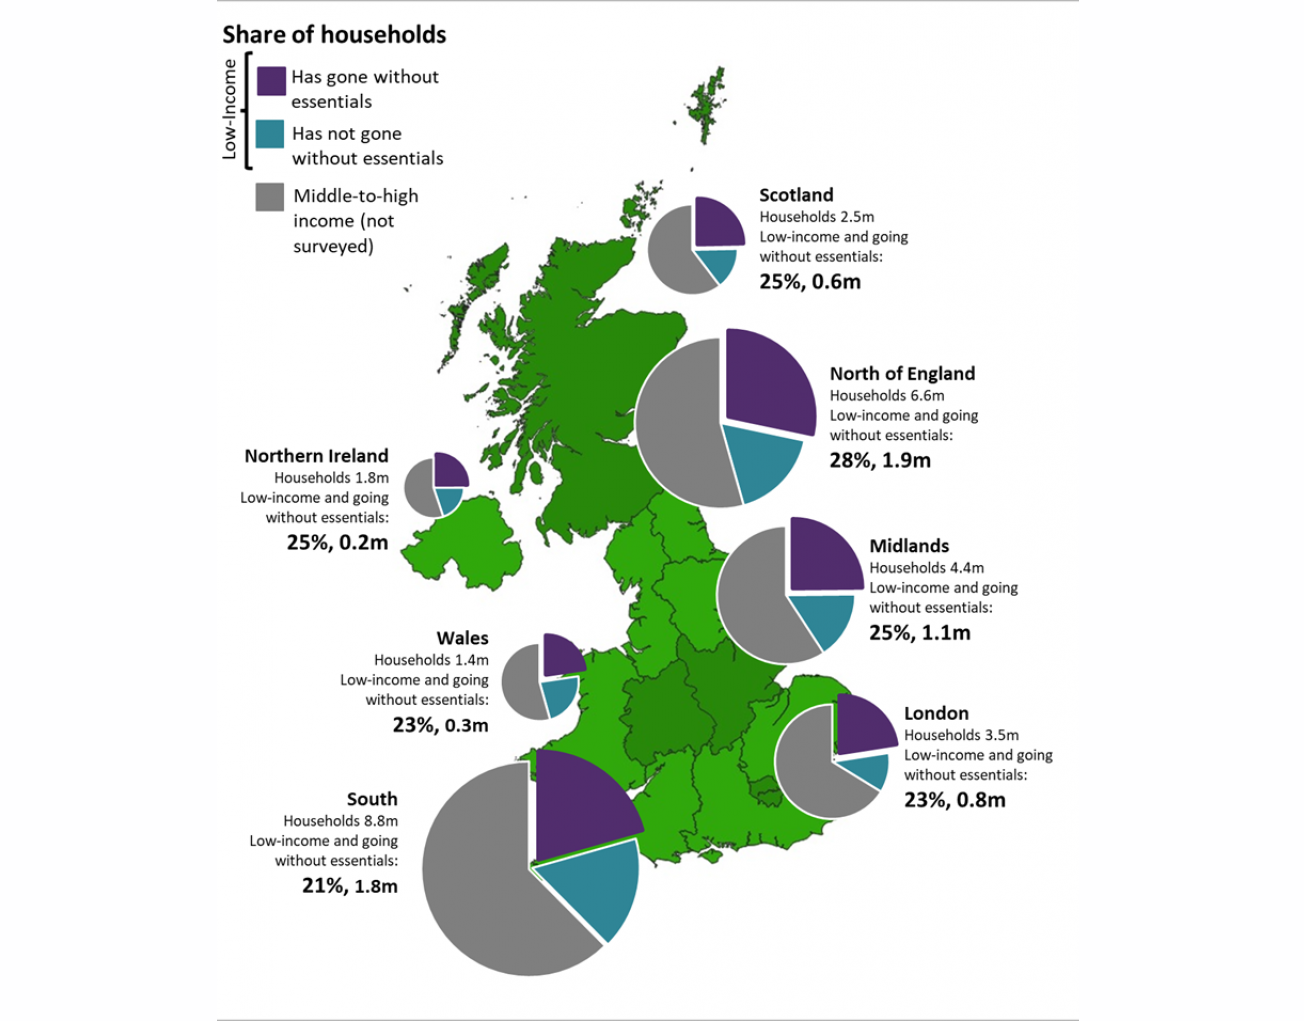
This is illustrated in the pie-graphs below which show that almost three in ten of the population in the North of England are on low-incomes and have gone without at least one essential – around 1.9 million households, as are a quarter of people in the Midlands, Scotland and Northern Ireland. The South of England (excluding London) has the lowest proportion of households on low-incomes and having gone without at least one essential. However, it is important not to understate the fact that huge numbers of people in these regions are also facing severe hardship; over a quarter (27%) of the households who are on low-incomes and going without at least one essential live in these regions.
Map: households on low incomes and the proportions who are going without essentials
As well as having the highest proportion of households on low-incomes and going without essentials, the Centre for Cities finds that cities in the North of England are experiencing higher rates of inflation (Rodrigues and Quinio, 2022).
One in four low-income Londoners are behind on energy bills and a quarter of low-income renters are in rent arrears, the highest number in the UK
Over half of Londoners reported being in arrears with at least one bill or outgoing, compared to an average of 40% for all low-income households, and a fifth were behind on four or more household bills. More than half of Londoners live in rented accommodation, either renting from private landlords (31%), housing associations or local authorities (22%). Almost a quarter of low-income renters in London told us they were in rent arrears (23%); the highest across all regions, and substantially higher than the national average of 17% (a rate consistent for both low-income private and social renters). In London and other cities in particular, substantial rent increases and limited availability of homes that are affordable for low-income renters are piling further pressure onto renters already facing impossible situations (Crisis, 2022).
Consistent with the rest of the country, the most prevalent type of arrears reported by Londoners was energy bill arrears, with almost a quarter behind on gas and / or electricity bills. Bucking the trend of being consistently worst off, a lower than average proportion of Londoners reported being unable to keep their home warm. However, this is still a large number of people, and likely reflects the fact that homes in London are typically smaller, more energy efficient and built as flats and terraced houses, and therefore easier to keep warm and less costly to heat, on average, as well as being more likely to be lived in by sharers who may split bills across multiple incomes. But these slightly mitigating factors for Londoners fade into insignificance in the context of doubling energy bills.
Even before October’s huge energy price increases, energy arrears are the most prevalent type of arrears cited. Being unable to heat homes was among the frequently cited essentials that families went without across every nation and region
The energy price cap, at £1,277 a year for typical usage last winter, has almost doubled to £2,500 a year from October 2022 under the new price guarantee (Lewis, 2022). Rocketing energy bills have already been driving extreme hardship across the UK even before these continued eye-watering increases, and the impact is clear from our survey. In every nation and region of the UK, the most prevalent type of arrear is now arrears on electricity or gas bills, with almost a fifth of low-income households (17%) reporting having this type of arrears, up from 12% in October 2021. Three in ten (28%) low-income households said they have been unable to keep their home warm at some point since the start of the year because it is unaffordable; this was the most prevalent essential that households reported having to go without, after food insecurity (with almost half (45%) of low-income households citing they had sometimes or often skipped meals or cut back on meals or gone hungry at some point in the last 30 days).
People in Scotland, Northern Ireland and the North of England are at the highest risk of being unable to keep their homes warm
We find that over a third of low-income households in Scotland and Northern Ireland and a third in the North of England were unable to keep their home warm, compared to around a quarter of people in the rest of the UK (excluding these countries and regions) on average. People in Scotland, the North of England and the Midlands were also more likely to report being in arrears on energy bills than average.
Graphs 2 and 3: low-income households who are unable to keep their homes warm and are behind on energy bills
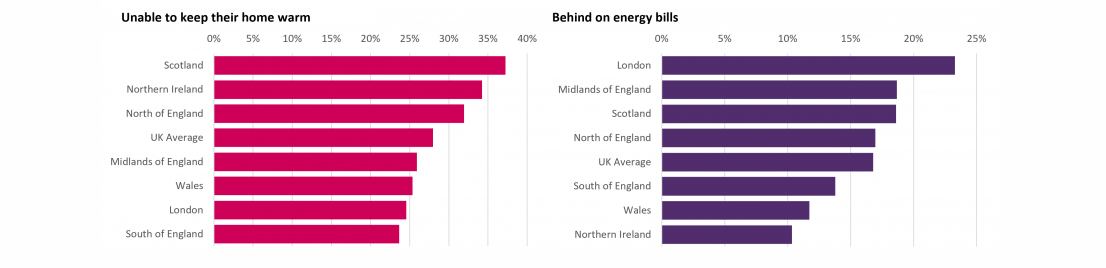
Tallying with analysis from the End Fuel Poverty coalition (2021) which finds a substantial north-south divide in fuel poverty rates, people in the north of the country are disproportionately likely to be in fuel poverty, driven by a combination of lower incomes and lower energy efficiency of housing stock, while the colder temperatures these areas reach require higher energy usage. National Energy Action estimate that energy price increases will lead to an increase in fuel poverty of more than 50%, even before prices are increased again later this year.
The different rates of hardships faced across regions are driven by differences in incomes, savings and expenditure, and the demographic make-up of regions
There are important factors that vary at local levels which can exacerbate the impacts of spiralling prices on families; high and rising housing costs, greater prevalence of poorer quality and less energy efficient housing, limited availability of lower-cost goods and services, poorer public transportation links and more limited access to, or availability of, services, among others. In a survey of all UK adults, among people who had experienced a rise in the cost of the living by the start of the year, Londoners were less likely than average to cite increases in fuel prices, but more likely to cite increases in rents or mortgage costs and the price of public transport, reflecting greater reliance on public transport and lower personal car use, and higher housing costs characteristic of cities.
Graph 4:
Some regions perform consistently worse than others in terms of the proportions of people experiencing different types of hardship, and the below graph demonstrates that this is still true when we control for other demographic variables such as age, tenure and household composition.
However, what the below graph demonstrates is that there is much greater variation between other types of demographic factors than geography. The most important drivers of these negative outcomes are simply inadequate incomes, lack of savings and high housing costs (relative to incomes), where people with low or no savings were most at risk of going without an essential, while people in the very lowest income decile also had disproportionately high risk. These groups are disproportionately composed of younger people, people in receipt of means-tested benefits, renters, families with children, people from a minoritized ethnicity and people with a disability in the household.
Graph 5: The proportions of people citing going without any essentials varies more by demographics than by where people live, although some parts of the UK perform consistently worse than others
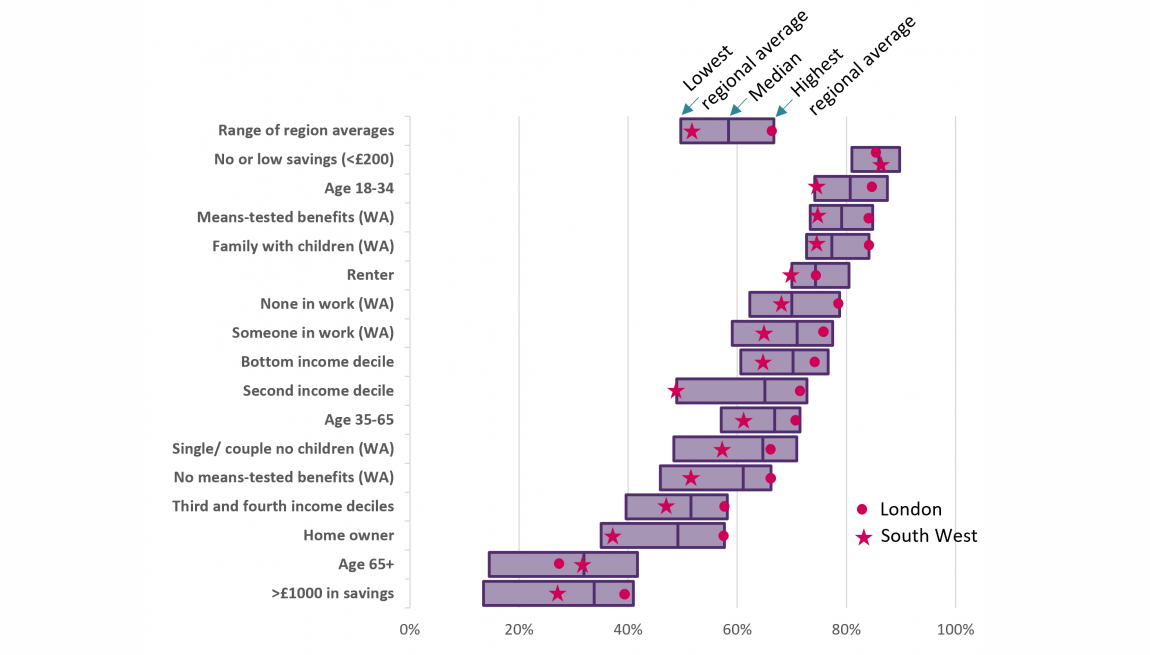
An important driver of the variation in outcomes across regions therefore is how the demographic composition of these areas varies; areas with higher proportions of the groups with the above characteristics have higher proportions of people reporting going without essentials and experiencing other forms of hardship. Take tenure: three quarters (75%) of renters in London reported going without at least one essential, which is a similar amount to the seven in ten (70%) in the South West, but much lower for owner-occupiers at 58% and 38% respectively. Over half of Londoners (51%) rent, compared to just a third (32%) of people in the South West. We see the same with age; 83% of Londoners aged 18-34 reported going without at least one essential, as did 75% of this group in the South West. The figures were 26% and 32% respectively for each region respectively for over 65s. London has the youngest population in the UK with only 13% of people in pension-age households, the South West has the oldest population with 23% in pension-age households.
The variation across these regions is explained by the differing age and tenure profiles, differences in composition across other demographics, and what these mean for patterns of income, savings and wealth, and expenditure – including on housing costs and other large household expenditure.
The Government must do more to help families across the country facing an impossible autumn and winter
What is clear from this analysis is that some groups are disproportionately exposed to the spiralling costs of living, but that across the whole country huge numbers of people are experiencing unprecedented levels of hardship. With the bleak economic outlook, with inflation anticipated to exceed 13% later this year, the forecast of a recession and a hike in interest rates set to squeeze borrowers, the Government must do more to help struggling families. In a letter to the new Prime Minister signed by 70 charities, JRF has called on the Government to strengthen the social security safety net so that people aren’t forced to choose between going without the essentials or getting into debt.
Sources:
Capstick, A (2022) What is the energy price cap? Money Saving Expert. Available at: https://www.moneysavingexpert.com/utilities/what-is-the-energy-price-cap/ [Accessed: 2 September 2022].
Crisis (2022) Falling short: housing benefit and the rising cost of renting in England. London: Crisis. Available at: https://www.crisis.org.uk/ending-homelessness/homelessness-knowledge-hub/housing-models-and-access/falling-short-housing-benefit-and-the-rising-cost-of-renting-in-england/ [Accessed: 30 September 2022].
Earwaker, R and Schmuecker, K (2022) Not heating, eating or meeting bills: managing a cost of living crisis on a low income. Joseph Rowntree Foundation Available at: https://www.jrf.org.uk/report/not-heating-eating-or-meeting-bills-managing-cost-living-crisis-low-income [Accessed: 5 September 2022].
End Fuel Poverty Coalition (2022) Fuel poverty map of England revealed. End Fuel Poverty Coalition. Available at: https://www.endfuelpoverty.org.uk/fuel-poverty-map-of-england-revealed/ [Accessed: 2 September 2022].
Rodrigues, G and Quinio, V (2022) Out of pocket: the places at the sharp end of the cost of living crisis. Centre for Cities. Available at: https://www.centreforcities.org/reader/out-of-pocket-the-places-at-the-sharp-end-of-the-cost-of-living-crisis/there-is-a-geography-to-the-cost-of-living-crisis/ [Accessed: 2 September 2022].
Methodology:
This blog presents the findings from a large-scale bespoke online poll of over 4,000 low-income households across the UK conducted by Savanta ComRes between 24 May and 7 June 2022.
For this report, ‘low-income households’ are defined as those in the bottom 40% of ‘equivalised’ national household incomes (see methodology note) – around 4 in 10 households in the UK.
See the methodology section on page 22 of the JRF report - Not heating, eating or meeting bills: managing a cost of living crisis on a low income (Earwaker and Schmuecker, 2022) for methods and definitions.
‘Unable to heat or eat’ means the respondent said that they had been unable to heat their home at some point since the start of the year, and in the last 30 days they sometimes or often cut back on or skipped meals or went hungry.
‘Has new debt’ means the respondent told us they had taken on new debt since the start of the year.
‘High risk debt’ means the respondent told us they currently had debt from a payday lender, an unlicensed lender, an authorised doorstep lender and / or a pawnbroker.

This briefing is part of the cost of living topic.
Find out more about our work in this area.