Households below a minimum income standard: 2008/9 to 2011/12
The latest household income data show trends in the numbers living below the Minimum Income Standard threshold up to early 2012.
The Minimum Income Standard (MIS) shows how much households need for an acceptable standard of living according to members of the public. The latest household income data show trends in the numbers living below this threshold up to early 2012.
Based on the latest data from the Family Resources Survey 2011/12 (ending April 2012), the report is the second in the “households below MIS” series.
Key points
- Overall there has been a deterioration in living standards, with the proportion of people living in households below MIS increasing by a fifth between 2008/9 and 2011/12.
- The most severe increase has been among single people of working age, where the percentage unable to afford this minimum acceptable standard of living rose from 29 per cent to 36 per cent.
- Among single people aged under 35 it rose even faster, from 29 to 42 per cent. This group also had an even greater increase in risk of having extremely low incomes, of less than half the minimum required.
- Two in three people in lone parent families are now below MIS.
- Pensioners and couples without children remain the most likely to have an adequate income.
A spreadsheet is available containing the data used for the report.
Summary
The Minimum Income Standard (MIS) shows how much households need for an acceptable standard of living according to members of the public. The latest household income data show trends in the numbers living below this threshold up to early 2012.
Background
Since 2009, household incomes have tended to fall in real terms. This has made it harder for many low-income households to make ends meet. The official poverty line of 60 per cent median income does not measure this phenomenon well, since if all incomes fall evenly, relative poverty will not change. An alternative indicator is the change in numbers falling below the Minimum Income Standard (MIS), based on detailed research showing what things members of the public think households need for an acceptable living standard.
Based on annual data from the Family Resources Survey, it is possible to monitor how many people fall below the MIS benchmark, and how this has changed since it was launched in 2008. The report, the second in the “households below MIS” series, uses the latest available data, which is for 2011/12 (ending April 2012).
The overall picture
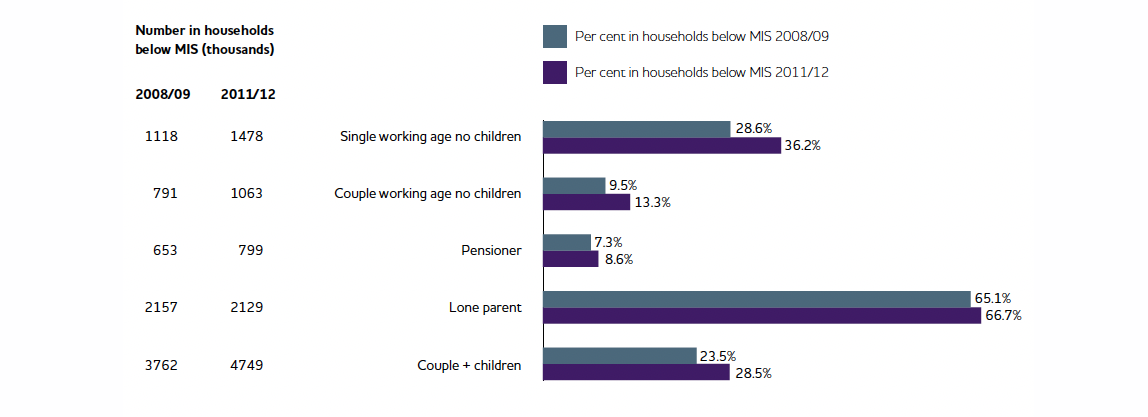
Figure 1 shows the overall picture of changes in the percentage of people below MIS over the three years following the economic downturn. Overall, the numbers falling below the standard rose by about one fifth, with most of the increase coming in at the end of the period, between 2010/11 and 2011/12. However, this measure only covers two thirds of households, excluding those comprising more than one adult other than partners. Thus, the breakdowns by household type shown in Figure 1 are more meaningful than the overall figure.
Trends by household composition
Single person households saw a particularly sharp increase in the risk of low income and of very low income during this period; they have been hit by unemployment and rising rents. Over a third now live below MIS. Families with children had not seen any increase in the risk of being below MIS up to 2010/11; in the early part of recession, relatively few such families were workless, and their tax credits were still rising. However, in 2011/12, the proportion of families below the standard rose sharply, as benefit and tax credit cuts started to kick in. Pensioners remain the least likely to live below this standard.
Trends by age, tenure and region
Young adults are the most likely group to have incomes below MIS, with over a third of under-35s below the threshold and over one in ten below half of MIS. This risk has increased, and young singles have seen a particularly dramatic increase in their risk of having less than half of what they need: from nine to 25 per cent for under-35s living alone. The meagre resources that many young people have when living on their own helps explain why many feel that they cannot afford this choice, and live in shared accommodation or with their parents. A parallel trend has been a growing proportion of low income and very low income households who live in the private rented sector. This is both because more are living in this sector and because it has become more expensive. Moreover, there are now more households below half of MIS renting privately than in social housing, showing that the stereotype of the poorest people in the country living in council houses is out of date.
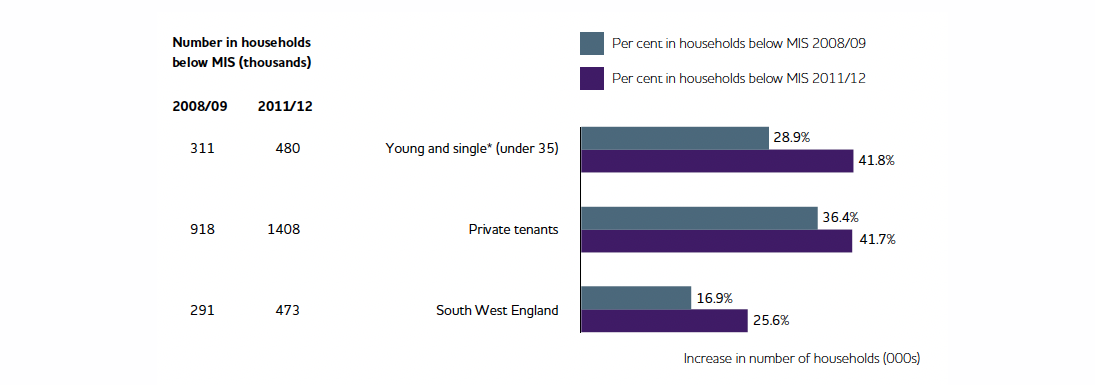
Trends in the numbers below MIS also vary by region. In London and Northern Ireland, the proportion has risen from about a quarter to about a third, while in the South West, the East Midlands, the West Midlands and the North East it rose from one in five or less to above one in four.
The overall income profile
The data in this study also shows a general downward shift in living standards across the distribution. Not only are more people below MIS, but more are living not far above that threshold. The greatest disparities are among single people, with over a third living below MIS, but nearly half having incomes over 50 per cent above this level. In contrast, fewer than one in ten lone parents live this far above the minimum.
Conclusion
Overall, these findings confirm that young people, single people and people in private housing have done particularly badly relative to their minimum needs in recent years, in particular in terms of the numbers having to live on very low incomes. These are the groups for which the recession has most consistently created additional hardship. However, this year’s figures also show that from 2011, families with children were being hit by cuts in benefits and tax credits, and their risk of falling short of the MIS standard was starting to rise. This change was most clear-cut for lone parents, who saw a fall in their (still high) risk of having inadequate income up to 2010, but a sharp reversal of that trend in 2011.
Subsequent policies are likely to have caused this deterioration to continue. The Minimum Income Standard, which gives an up-to-date benchmark of what the public consider to be an acceptable living standard, will continue to produce an annual monitor of how these trends unfold, and whether things improve during an economic recovery.
About the project
The team at the Centre for Research and Social Policy at Loughborough University who compile the Minimum Income Standard for the UK examined data from the Family Resources Survey and compared actual household incomes with the MIS benchmarks for each household type.
- Overall there has been a deterioration in living standards, with the proportion of people living in households below MIS increasing by a fifth between 2008/9 and 2011/12. Most of the increase came in the final year of this period.
- The most severe increase has been among single people of working age, where the percentage unable to afford this minimum acceptable standard of living rose from 29 per cent to 36 per cent.
- Among single people aged under 35 it rose even faster, from 29 to 42 per cent. This group also had an even greater increase in risk of having extremely low incomes, of less than half the minimum required: this risk rose from 9 per cent to 25 per cent.
- This dramatic deterioration in young people’s fortunes is associated with growing unemployment, declining benefit levels and a sharp increase in private renting, where disposable income can be severely affected by high rent levels.
- While the incomes of families with children held up in the first part of the recession, from 2011/12 they became more likely to fall below MIS, as previous increases in benefits and tax credits started to reverse. Two in three people in lone parent families are now below MIS.
- Pensioners and couples without children remain the most likely to have an adequate income. However, more working-age couples are finding themselves on a just-adequate income rather than being well above the minimum.