A minimum income standard for the UK in 2011
JRF's annual update, based on what members of the public think people need to achieve a socially acceptable standard of living.
JRF's annual update, based on what members of the public think people need to achieve a socially acceptable standard of living.
Over time, changes in prices affect the cost of a minimum standard of living (MIS), and changes in social norms change the 'minimum' that is required. This study considers both of these, and updates the MIS budgets to April 2011.
This report shows:
- what incomes different family types require in 2011 to meet the minimum standard; and
- how much the cost of a minimum household budget has risen since the last update in 2010.
This update of MIS is based on increases in living costs. The findings also reflect important changes in the tax and benefits systems, which affect how well people living on benefits can afford necessities and how much people in work need to earn in order to reach a minimum net income. The research describes how people on lower incomes are feeling the squeeze caused by a combination of sluggish income growth, relatively rapid price increases, and tax and benefit changes.
Summary
This report is JRF's annual update of the 'minimum income standard', based on what members of the public think people need to achieve a socially acceptable standard of living. The 2011 figures reflect price increases and the effect of changing tax and benefit rates.
Key points
- A single person needs to earn at least £15,000 a year before tax in 2011, to afford a minimum acceptable standard of living. A couple with a single earner and two children need at least £31,600.
- Inflation raised minimum household budget costs by around 5 per cent in the year to April 2011, slightly faster than the Government's main inflation measure, the Consumer Prices Index (CPI). Over the past decade, the cost of a 'minimum' basket of goods and services has risen by 43 per cent, compared with 27 per cent for CPI.
- Out-of-work benefits remain well below people's requirement for a minimum living standard, but pensioners claiming Pension Credit have incomes close to their minimum needs. Over the past three years, benefit levels have deteriorated relative to the income required to meet people's minimum needs.
- The rise in personal tax allowances in April 2011 means that for a single person to afford the minimum, the wages required have increased by less than inflation.
- For families with children, by contrast, the earnings required to make ends meet have risen much faster than living costs, because Child Benefit has been frozen and tax credits reduced for many families. Most importantly, tax credits helping low-income families to cover childcare costs have been cut. Typically, families requiring childcare would have to earn over 20 per cent more in 2011 than in 2010 to meet the shortfall.
Background
JRF published the first minimum income standard (MIS) in 2008. It is updated regularly to reflect changes in costs and living standards. The standard covers the whole of the UK; supplementary research in 2010 identified additional and different needs in rural areas. The present report updates the main and rural figures to take account of inflation.
MIS calculations are based on research that asks members of the public to identify the items a household would need to reach a minimum acceptable standard of living, covering essential requirements and allowing people to participate in society.
Price changes
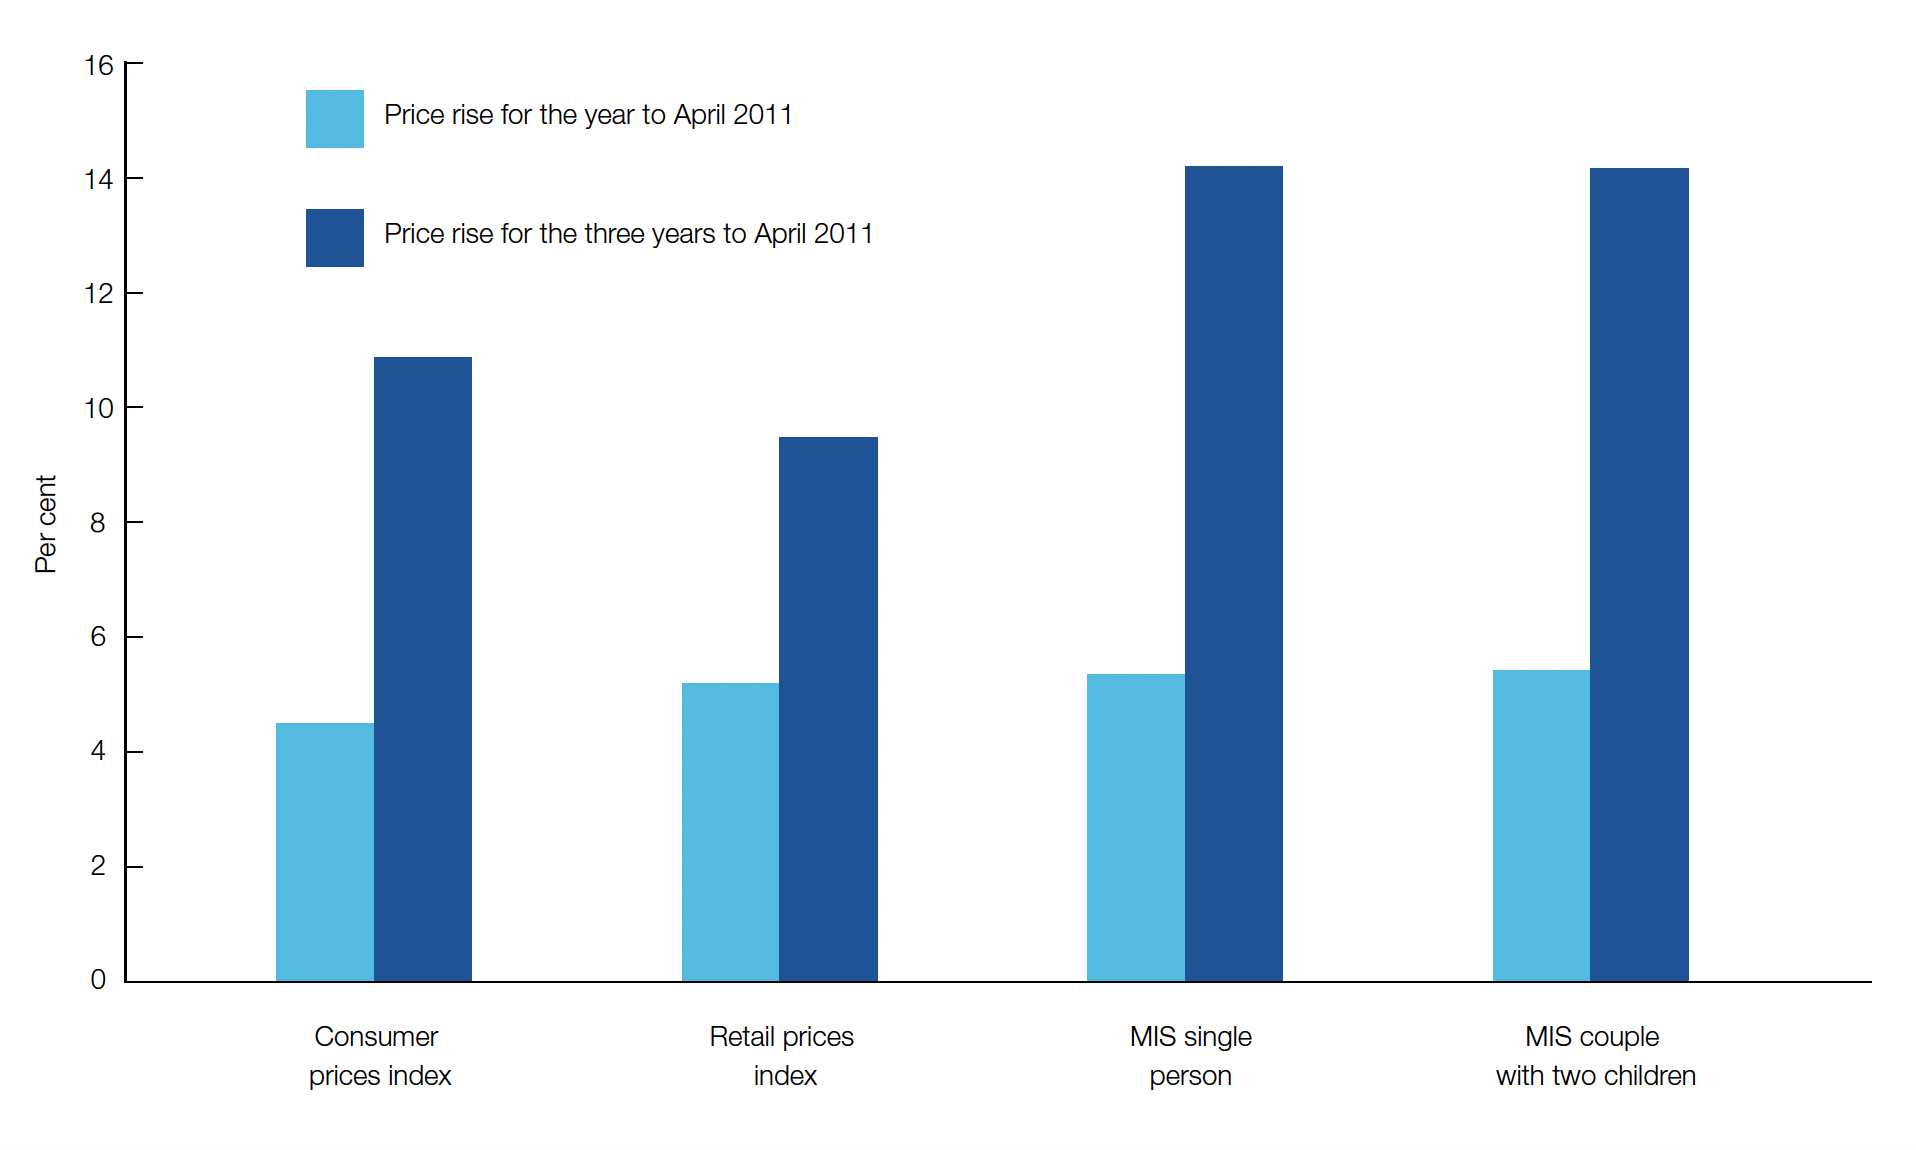
According to official figures, the year to April 2011 saw inflation at its highest level for five years. The Consumer Prices Index (CPI) rose by 4.5 per cent and the Retail Prices Index (RPI) by 5.2 per cent. However, the cost of a minimum household budget does not necessarily change at the same rate as general inflation. The minimum budget is strongly influenced by the price of items such as food, which form a bigger proportion of this budget than for the basket of goods used to calculate CPI. Where such items rise in price relatively quickly, the minimum budget increases by more than the general inflation rate.
In the past year, the cost of minimum budgets for various households has risen by 4.7 to 5.7 per cent – faster than CPI and about the same as RPI. Figure 1 shows that since the launch of MIS three years ago, minimum budgets have become 14 per cent more expensive, compared with 11 per cent for CPI and 10 per cent for RPI. Over ten years the gap has been even greater, with the minimum cost of living rising by 43 per cent compared with increases of 27 and 35 per cent in CPI and RPI respectively.
These differences matter greatly in terms of the actual adequacy of household incomes, since many people on low incomes rely on benefits and tax credits which are now uprated by CPI. In future years, much will depend on the relative price of certain basics. Food prices continue to rise, but last year they did so at the same rate as overall CPI. However, if rising world demand continues to push up commodity prices, in future years minimum costs could again rise faster than the UK's official inflation rate.
Family type | Single working-age person | Pensioner couple | Couple + 2 children | Lone parent + 1 child |
|---|---|---|---|---|
| Weekly budget excluding rent/childcare | £184.68 | £232.74 | £424.65 | £246.37 |
| Percentage inflation rise since 2010 | 5.3% | 4.7% | 5.4% | 5.4% |
| Percentage of median income, after housing costs, required for MIS (2009/10) | 74% | 54% | 74% | 73% |
| Percentage of budget* provided by Income Support/Pension Credit | 40% | 100% | 62% | 64% |
| Earnings calculation: | ||||
| Weekly budget including rent and childcare | £240.89 | n/a | £705.63 | £466.08 |
| Annual earnings required | £15,000 | n/a | £36,800** | £18,243 |
| Hourly wage requirement | £7.67 | n/a | £9.41** | £9.33 |
*Excluding council tax.
**If both members of couple work full time. A single-earner couple without childcare would need £31,584, but this would require a wage of £16.15 an hour.
Budgets for April 2011
Table 1 shows MIS revised budgets for April 2011, alongside key comparisons.
Most budgets for working-age households are substantially above the 60 per cent median income threshold used to measure poverty. However, pensioner couples are below that threshold on an 'after housing costs' measure. In the present recession, weak growth in average incomes has coincided with rising prices, which has put up the level of incomes required to make ends meet. This 'squeeze' has produced an increase in the percentage of average incomes that people need to make ends meet. For example, a single person needed 72 per cent of median income to reach a minimum living standard in 2008/09, but 74 per cent in 2009/10. Hence people on low incomes are becoming worse off relative to their requirements, unless their incomes rise more than average.
For non-working families, benefits provide much too little to reach the minimum budget for people of working age, but enough for pensioners, provided that those on low incomes claim Pension Credit. Benefit adequacy has declined somewhat in the past three years, because inflation upratings have not kept up with the actual cost of the minimum standard.
For most households in work, the pay rate required to reach the minimum standard remains well above the national minimum wage, currently £5.93 an hour. A single person now needs to earn £15,000 a year to reach MIS, the equivalent of £7.67 an hour working full time. This rate has risen slightly more slowly than inflation in the past year, because the £1,000 rise in the tax allowance in April 2011 means that a single person can reach a slightly higher net income from a given salary than a year ago.
However, for families with children, the amount they need to earn to afford the minimum budget has risen much faster than the cost of living. This is the result of three main changes announced in the June 2010 budget and introduced in April 2011: child benefit rates were frozen; the rate at which families lose tax credits as their income increases was raised by two percentage points; and the rate at which childcare costs are reimbursed through the tax credit system was cut from 80 per cent to 70 per cent.
The cut in childcare support was particularly important. It means, for example, that someone with two children paying £200 weekly in childcare may have to contribute £60 rather than £40 to these costs – a 50 per cent increase. Making up the shortfall would require an extra £1,000 a year in disposable income. To generate this would require additional gross earnings of about £3,700, with £1,200 then deducted in tax and National Insurance contributions and a reduction of £1,500 in tax credits. This helps to explain why a couple with two children, both parents working full time, would need to earn 24 per cent more in 2011 than in 2010 to cover a minimum budget, once childcare costs are taken into account.
Conclusion and policy implications
The squeeze in living standards caused by the combination of rising prices and stagnant incomes is hitting people on low incomes hard. This is partly because they face relatively high inflation rates, but also because of policy decisions that have restricted their net incomes. In particular, the reduction in support for childcare has made many low-earning families worse off. In the process, it has substantially reduced the incentive to work for relatively low pay for families who need to use childcare in order to do so.
This experience has important lessons for the design of welfare reform, and particularly for the introduction of the Universal Credit. Policy decisions will have crucial implications for the ability of working-age families to make ends meet through modest earnings, and consequently for their work incentives. The evidence from 2011 shows that even a seemingly modest change – such as adjusting the rate of childcare support given in the tax credit system – can have a major impact on families' ability to earn enough to reach an acceptable standard of living. The Universal Credit seeks to make it easier for non-working families to earn small amounts through a bit of work, but the risk is that it could do so by trapping more families on incomes that remain well below what they need to live at a minimum acceptable level.
About the project
This update was carried out at the Centre for Research in Social Policy at Loughborough University, by the team that conducted the initial MIS research. Over 50 groups of members of the public have been involved in this research to date, which has also used experts to check that budgets properly covered needs such as nutrition and household heating.