A minimum income standard for the UK in 2012
What income do people need to achieve a socially acceptable standard of living? This report reflects changes to costs and living standards, updating the Minimum Income Standard (MIS) budgets to April 2012.
Summary
Key points
- A single person in the UK needs to earn at least £16,400 a year before tax in 2012, to afford a minimum acceptable standard of living. Two parents need to earn at least £18,400 each to support themselves and two children.
- Members of the public have not fundamentally altered their view of what comprises a minimum acceptable standard of living in the UK since the original MIS published in 2008.
- In some areas of life, however, the minimum has gone down. For example, in today's harsher economic climate, pensioners and families with children specified lower minimum budgets for eating out and for exchanging Christmas and birthday presents.
- In other areas, new requirements have emerged since 2008. Computers and the internet are now considered necessities for all working-age families. Families with children living in urban areas outside London stated that a car has become essential to meet an acceptable living standard.
- Since 2008, actual incomes have risen much more slowly than minimum income requirements. While required earnings for single people have risen in line with prices, for families with children they have risen much faster than this – by 16 per cent more than inflation for a couple with two children. In addition to the effect of higher living costs, cuts in tax credits for families with children have outweighed the benefit of higher tax allowances.
Background
JRF published the first minimum income standard (MIS) in 2008. The MIS is updated annually to reflect changes to costs and living standards. It is based on detailed deliberation by groups of members of the public. They identify the items a household would need in order to reach a minimum acceptable standard of living that allows its members to participate in society. In 2012, the most thorough update of the research so far investigated how far changes in living standards and expectations have caused the socially defined minimum to change since the initial MIS, which was calculated before the economic downturn.
Household needs in 2012
The most important finding was that there has been a high degree of continuity in what the public consider to be an adequate standard of living, despite unstable economic times. The great majority of items in essential baskets of goods and services were very similar in this study to the original research carried out in 2007/8. Hard times do not appear to have caused the British public to rethink fundamentally what households need in order to meet a minimum socially acceptable living standard. Nevertheless, certain areas of the budgets have changed significantly. In 2012, for the first time, families with children (but not households without children) living in urban areas outside London defined a car as essential. Focus groups’ perceptions of the declining adequacy of public transport seemed to resonate with evidence of cuts in services and sharp price rises since 2007/8. Parents taking part in the research agreed that public transport is expensive and not sufficiently flexible and reliable to meet the needs of families with children. A further addition since the original research is that computers and the internet are now considered necessities for all working-age families, not just for those with school-age children.
| Family type | Single working-age person | Pensioner couple | Couple + 2 children | Lone parent + 1 child |
|---|---|---|---|---|
| Weekly budget excluding rent/childcare | £192.59 | £231.48 | £454.52 | £275.59 |
| Percentage increase since 2008 (for comparison: CPI rose by 14%) | 22% | 15% | 23% | 31% |
| Percentage of median income, after housing costs, required for MIS (2010/11) | 77% | 57% | 77% | 77% |
| Percentage of budget* provided by Income Support/Pension Credit | 40% | 104% | 60% | 59% |
| Earnings calculation: | ||||
| Weekly budget including rent and childcare | £262.25 | n/a | £685.04 | £502.80 |
| Annual earnings required | £16,383 | n/a | £36,728** | £23,861 |
| Hourly wage requirement | £8.38 | n/a | £9.39** | £12.20 |
* Excluding council tax
** If both members of the couple work full time
The resulting increase in MIS budgets for families with children is partially offset by a reduction in budgets for recreational activities and other aspects of social participation. For example, although eating out and exchanging Christmas and birthday presents remain an essential part of social participation, parents said that eating out could be less frequent than specified in 2007/8, and they set a lower budget for the gifts that members of a couple would buy for each other. Pensioners also specified less for eating out and exchanging presents.
MIS levels in 2012
Table 1 shows the levels of MIS budgets updated to April 2012, how they compare to average household incomes, and to benefits, and what earnings are needed to achieve these net income levels. It shows that for pensioners, minimum weekly costs have risen by a similar amount to the Consumer Prices Index (CPI) since 2008. However, for other household types the increase in costs has been substantially greater, in part due to higher-than-average inflation in items such as food and in part because of additional items. These higher costs mean that out-of-work benefits fall even further short of providing a minimum living standard for non-pensioners than they did in 2008. For working households, the pay rate required to reach the minimum income standard remains well above the National Minimum Wage, currently £6.08 an hour.
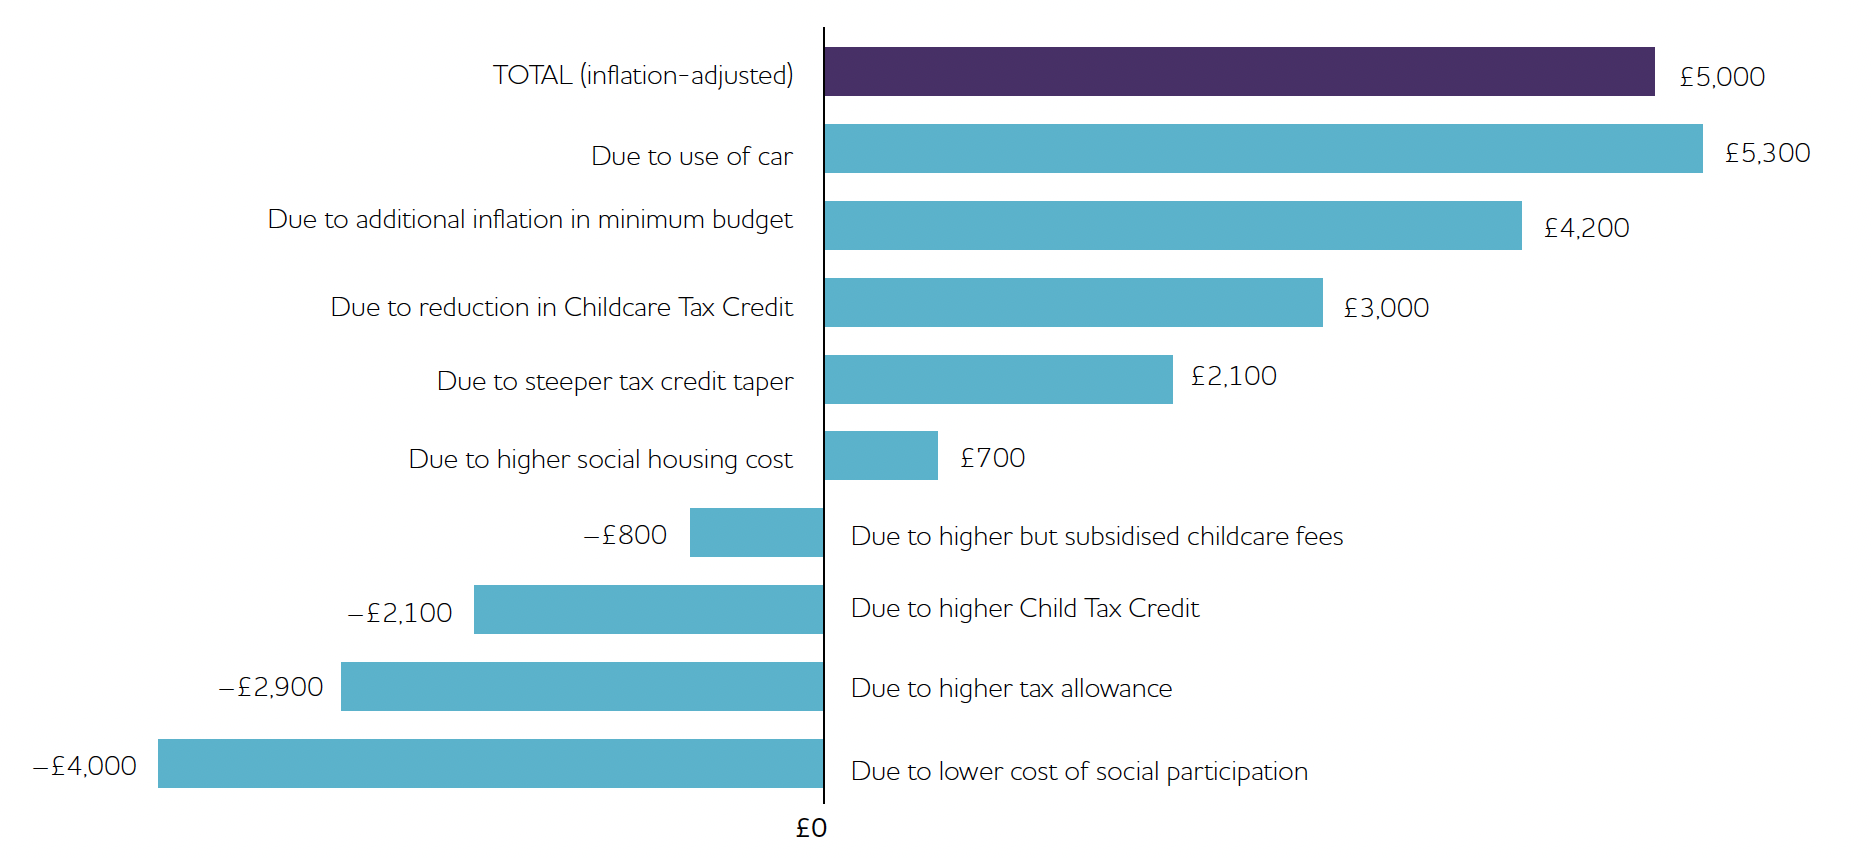
Notes: The top bar shows how much more this family needs to earn than in 2008, adjusted for CPI inflation (this is not the sum of the figures shown in the other bars, which do not cover every change). The remaining bars show how much certain factors have contributed to this change, by comparing actual earnings requirement with the following scenarios:
Use of car – if 2012 transport costs were the same, inflation-adjusted, as in 2008, when no car was specified.
Additional inflation in MIS – if the price of goods and services in 2012 baskets had all risen in line with the whole CPI, rather than some categories inflating faster than others. Reduction in childcare tax credit – if childcare costs eligible for support had not been reduced from 80 to 70 per cent in 2011.
Steeper tax credit taper – if the rate at which tax credits are reduced with rising income had not been increased in 2011.
Higher social housing costs – if social rents had risen only by the CPI.
Higher but subsidised childcare fees – if childcare costs had risen only by the CPI, but as in 2008, 15 hours' free childcare for three to four year olds was not subtracted from costs.
Higher Child Tax Credit – If the value of the credit had not been increased faster than CPI since 2008.
Higher tax allowance – If personal tax allowances had not been increased faster than CPI since 2008.
Lower cost of social participation – if budgets for recreation, eating out and presents were the same as in 2008, inflation-uprated.
Influences on changing earnings requirements since 2008
The £16,400 a year which a single working-age person needs to earn to reach MIS is similar to the amount required in 2008 uprated by the CPI. Although minimum living costs have risen somewhat faster than this, the raising of tax allowances has kept earnings requirements down.
For families with children, on the other hand, growth in the cost of the MIS baskets has combined with changes to the tax and benefits system to produce substantially greater earnings requirements. Figure 1 (above) illustrates what lies behind the increase in earnings requirements since 2008 for a couple with two children, showing a range of factors in different scenarios. For this type of family, on top of the extra cost of running a car, the effect of cuts in tax credits has outweighed two prominent measures to help low income families: Labour's flagship child poverty reduction policy of increasing Child Tax Credit and the Coalition's flagship tax policy of increasing personal allowances.
Conclusion and policy implications
This study shows that the minimum needed by families for an acceptable living standard remains similar in harsh economic times as it did previously, but that it is getting harder to earn enough to meet this standard. The gap between the incomes and needs of the worst-off households is widening, especially for families with children. The findings illustrate the vulnerability of low-income families to the effect of cuts in services (including bus services, which can raise family transport costs) and in support through tax credits. In this context, the level at which the Universal Credit (which is being introduced from late 2013) is set will strongly influence the ability of households on low incomes to reach a minimum acceptable standard of living.