Monitoring poverty and social exclusion in Northern Ireland 2014
The latest data on poverty in Northern Ireland, focusing on the links between poverty, work, disability and age.
Northern Ireland’s labour market and poverty rates have deteriorated in the last five years, in addition to longstanding issues of mental health and community divisions – and welfare reforms are likely to exacerbate these problems.
This new research by the New Policy Institute for JRF finds that:
- between 2006/07 and 2011/12 the average (median) income in Northern Ireland (NI) fell by almost 10 per cent compared with 7 per cent for the UK as a whole;
- the proportion of unemployed working-age people in NI almost doubled between 2007/08 and 2012/13 to reach 5.8 per cent;
- in the same period, the proportion working part-time and wanting full‑time work has gone up from 1.7 per cent, the same as in Great Britain (GB), to 4.4 per cent (compared with 3.5 per cent in GB).
Summary
This Findings from the New Policy Institute brings together the latest data to show the extent and nature of poverty in Northern Ireland. It focuses on the links between poverty, work, disability and age.
Key points
- Household incomes, poverty rates and the labour market have all worsened in Northern Ireland (NI) in the last five years. In each case, this deterioration has been greater than in Great Britain (GB).
- Between 2006/07 and 2011/12 the average (median) income in NI fell by almost 10 per cent compared with 7 per cent for the UK as a whole. The fall at the bottom of the income distribution was also much greater in NI.
- The proportion of unemployed working-age people in NI almost doubled between 2007/08 and 2012/13 to reach 5.8 per cent. Growth in the proportion working part-time and wanting full‑time work has been greater – it increased from 1.7 per cent (the same level as GB) to 4.4 per cent (compared with 3.5 per cent in GB).
- The proportion of pensioners in poverty in NI fell from 19 per cent to 16 per cent in the five years to 2011/12. For working-age adults and children the poverty rate rose over this period.
- In the five years to 2011/12, the poverty rate among adults aged 16 to 29 rose by 8 percentage points to reach 26 per cent. Among those aged 30 to 59 poverty has also increased but it has solely been among those in working families.
- If disability-specific benefits are not counted as income, Northern Ireland’s poverty rate increases from 22 per cent to 24 per cent; at least as high as any part of the UK outside London.
- The status of welfare reform in NI is unclear, but the extent of its impact would be wider than in GB. The proportion of claimants in NI potentially affected by either the under-occupation penalty or the change to Disability Living Allowance is double the level in GB.
Incomes
The backdrop to this Findings is a sharp and sustained fall in incomes across the whole of the UK. NI is no exception – indeed, it may be the most extreme example.
Figure 1 – Changing incomes in Northern Ireland and the UK
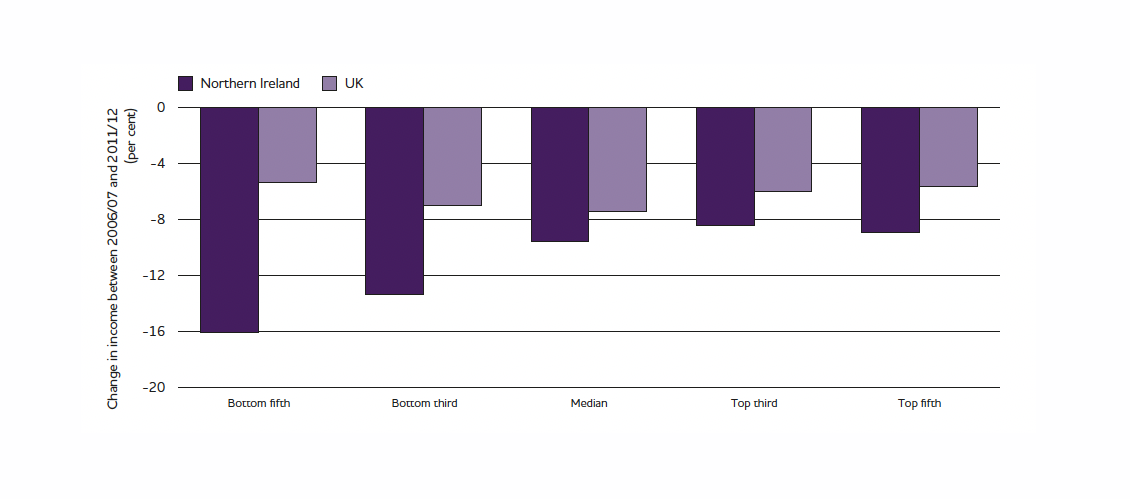
Between 2006/07 – the year before the recession began – and 2011/12, average (median) household incomes in NI fell by just under 10 per cent (from £372 per week to £336), compared to 7 per cent in the UK as a whole (from £396 to £367).
Falls were more pronounced further down the income distribution, as was the difference between NI and the UK average. The incomes of the bottom fifth fell by 16 per cent in NI, compared with around 5 per cent in the UK. For the bottom third, the figures are 13 per cent and 7 per cent.
In 2006/07 incomes at the bottom fifth were higher in NI than in GB; they are now lower.
Income poverty
The measure of poverty we use in this Findings is based on household income. Income is measured after taxes and housing costs have been paid. A household is considered to be in poverty if its income is below 60 per cent of the median income that year. This median is measured at the UK level, which allows us to compare NI with other parts of the UK.
The poverty threshold is adjusted to account for household size and composition. In 2011/12, it was £220 per week for a couple with no children, and £308 for a couple with two young children.
A general fall in incomes affects the poverty measure, as the poverty threshold is set relative to the median income in each year. So the 2011/12 poverty line is lower than it was in 2006/07 (£220 per week for a couple without children compared with £238). In total, there are 55,000 people in NI whose household income is above the current poverty line, but below the 2006/07 line.
| Children | Working-age with children | Working-age without Children | Pensioners | |||||
|---|---|---|---|---|---|---|---|---|
| NI | GB | NI | GB | NI | GB | NI | GB | |
| 2006/07 | 26% | 30% | 19% | 18% | 16% | 18% | 20% | 18% |
| 2011/12 | 27% | 28% | 21% | 16% | 20% | 20% | 16% | 14% |
| Change | +0.9% | -1.7% | +1.4% | -1.6% | +4.4% | +2.1% | -3.5% | -3.5% |
Source: Households Below Average Income, DWP (figures may not add up due to rounding), data is a three-year average to the years shown
Pensioners were the only group in NI to experience a fall in the poverty rate, of 3.5 percentage points (the same as the drop for pensioners in GB). They now have the lowest poverty rate of all age groups shown, at 16 per cent. Children have the highest poverty rate at 27 per cent. The poverty rate for children and their parents has slightly increased in the last five years in NI whereas in GB it has slightly decreased.
Overall, NI is keeping pace with GB in terms of its improvement in the poverty rate among pensioners, although the rate is higher in NI. But for all other groups the poverty rate in NI is moving in the wrong direction and is deteriorating at a faster rate than in GB.
NI also has a higher poverty rate than the rest of Ireland. Using the before housing costs measure, 21 per cent of people in NI were in poverty in 2011, compared with 15 per cent in the Republic of Ireland. Within NI, the proportion of people living in poverty is highest in Belfast followed by the west and then the east.
Working-age adults without children are the only group to have experienced a significant increase in the poverty rate, with a rise of four percentage points (double the increase in GB) to 20 per cent. The poverty rate for working-age adults without children has increased across all UK jurisdictions and English regions.
Figure 2 – Change in the number of adults in poverty in Northern Ireland by work status and age group
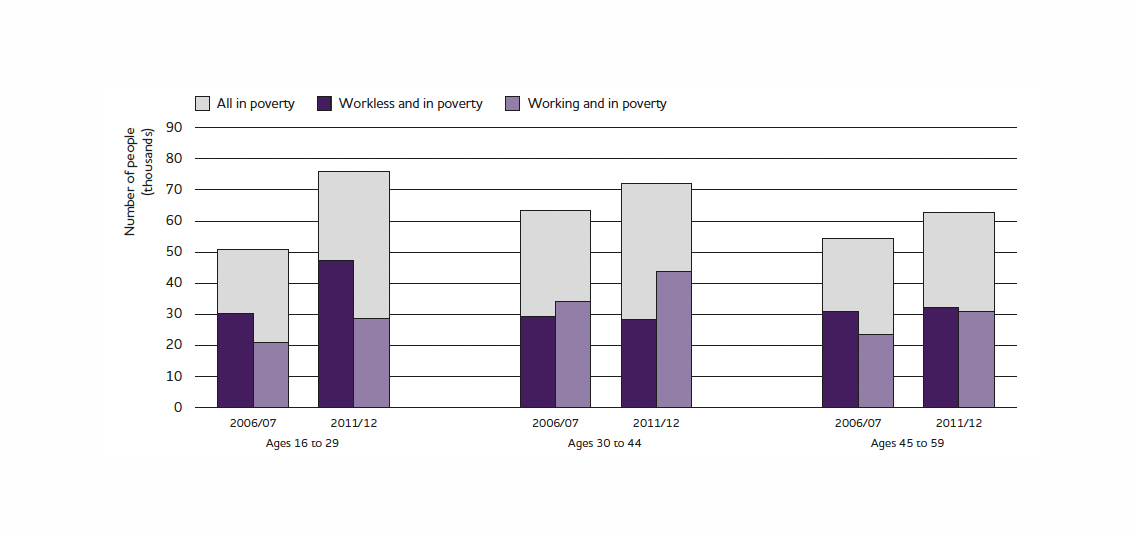
For each age group shown, the number of people in poverty increased between 2006/07 and 2011/12. This has been greatest among those aged 16–29, increasing from 52,000 to 77,000 (up 50 per cent). Most of these are workless younger adults in poverty whose numbers have increased by 17,000. Conversely almost all of the increase in poverty for those aged between 30 and 59 has been among adults in a family where someone is working.
So the nature of poverty is now very different across the age ranges. For younger adults poverty is dominated by those in a workless family (62 per cent of adults aged 16 to 30 in poverty live in a workless family). But over half of adults aged 30 to 59 in poverty live in a family where someone is in work.
The poverty rate has also become very uneven by age. In 2006/07 the poverty rate across these age groups was quite even with 16–29-year-olds at 19 per cent compared with 18 per cent for those aged 30–59. By 2011/12 a gap opened and the poverty rate for 16–29-year-olds reached 26 per cent compared with 20 per cent and 19 per cent for those aged 30–44 and 45–59 respectively. This age disparity has occurred across the UK but in GB it has been part of a longer-term trend; in NI the age disparity is a much more recent development.
Disability and poverty
Poverty is based on a household’s income level so it includes income from earnings but also from benefits such as the disability-related benefits of Disability Living Allowance (DLA) and Attendance Allowance (AA). A much higher proportion of families receive DLA or AA in NI (20 per cent) than in the rest of GB (13 per cent). These benefits are intended to help towards the additional costs associated with having a disability. It can therefore be argued such income should be excluded when calculating if a household is in poverty. If such an approach were taken the poverty rate in NI would increase from 22 per cent to 24 per cent, the largest rise of any part of the UK, and the highest rate of anywhere outside London.
Jobs and the labour market
The previous section showed that there has been a rise in workless poverty among younger age groups and a rise in in-work poverty among older working-age adults. So what has happened to the labour market in NI since the start of the recession?
Unemployment is clearly part of, but not the whole of, the story. Figure 3 looks at three different measures of lacking work – unemployed people, those who are economically inactive but want to work and those in part-time work who want a full-time job.
Figure 3 – Underemployment over time, Northern Ireland and Great Britain
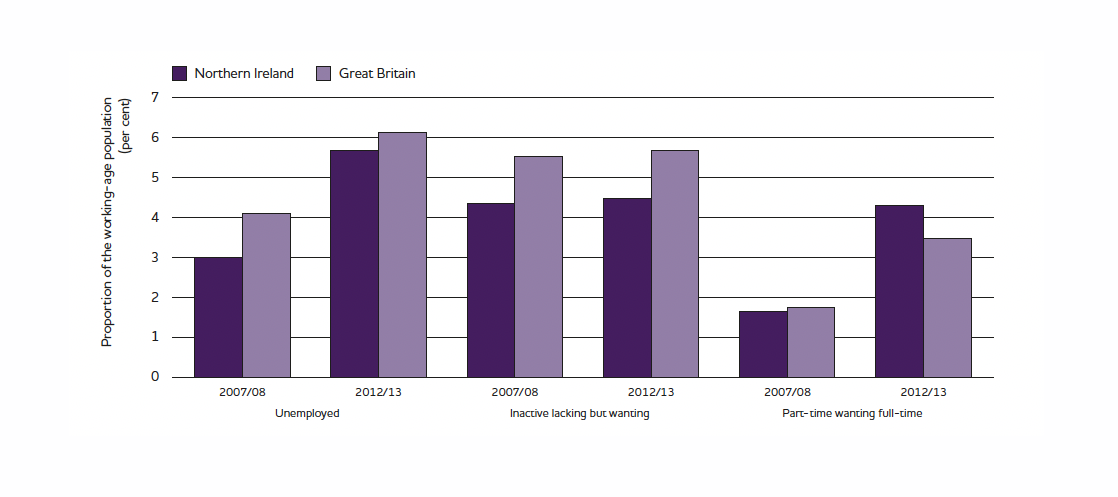
Unemployment increased by more in NI than in GB between 2007/08 and 2012/13 to reach 5.8 per cent; a level now only slightly lower than GB.
A further 4.5 per cent of working-age people in NI wanted work but were classed as economically inactive (currently not available for work or not actively seeking work). This is up only slightly on the figure five years earlier.
The proportion of the working-age population who worked part-time but wanted full-time work is now higher in NI than GB having risen further over the last five years. Around 4.4 per cent of working-age people in Northern Ireland (51,000) now work part-time, but want to work full-time, compared with 3.5 per cent in GB.
The Northern Ireland labour market stands out from Great Britain on other measures as well. In NI 36 per cent of those unemployed have been unemployed for over two years, compared with 18 per cent in GB. Additionally, the employment rate of disabled people in Northern Ireland is 35 per cent, compared with 50 per cent in England and around 45 per cent in Scotland and Wales. This reflects the much higher level of economic inactivity among disabled people in Northern Ireland rather than higher unemployment.
The total number of people in employment in NI has risen with the rising population, but all of this increase has been among part-time workers. By 2013 there were 27,000 more part-time workers than in 2007 and 3,000 fewer full-time workers.
So do these labour market changes explain the fall in household incomes described above? The number of families where all adults were unemployed doubled in NI between 2006/07 and 2011/12, compared with a rise of two-thirds across the UK as a whole. Such households remain rare, making up only 5 per cent of the total in NI.
But over the same period there has been a much greater shift in the amount and type of work done by households. The number of families where the main earner was self-employed rose by 6 per cent in NI (compared with only 2 per cent in the UK), and the number where the main earner was working part-time rose by 30 per cent (compared with 20 per cent in the UK). Meanwhile the number of families where all adults were in full-time work fell by 6 per cent (compared with only 2 per cent in the UK).
When these are taken together, these trends point to a decrease in the number of families on higher incomes in NI and an increase in the number on lower incomes. This happened across the UK, but was most pronounced in Northern Ireland.
Welfare reform
So far this Findings has been retrospective, looking at the changes in incomes and employment over the last five years. This section looks ahead to the possible effects of welfare reforms that have been implemented in GB but not yet in NI.
Table 2 sets out five changes – the under-occupation penalty (often referred to as the ’bedroom tax‘), the introduction of the overall benefit cap, the replacement of Disability Living Allowance with Personal Independence Payments, the introduction of Universal Credit and the time limiting of Employment and Support Allowance.
| Welfare reform | Fiscal impact | Numbers affected | Proportion affected (GB in brackets) | Income change (GB in brackets) |
|---|---|---|---|---|
| Under-occupancy penalty ('bedroom tax') | £17m saving per year | 33,000 working-age social rent Housing Benefit (HB) claimants | 53% of working-age social rent HB claimants (23%) | Average loss of £10.30 a week (£14.48) |
| Benefit cap | £1.7m saving per year | 3,970 people in 620 households | 0.1% of working-age households (0.2%) | Average loss of £53.28 a week (£93) |
| Personal Independence Payment | £30m saving per year by 2015 | 27,000 claimants to be assessed by 2015, 118,000 working-age claimants overall | 10.6% of working-age population claim DLA (5.4%) | 25% lose entitlement, 33% reduced, 23% increased, 19% no change (30%, 29%, 27%, 14% respectively) |
| Universal Credit | £35m increase in entitlements per year | 287,000 households expected to receive UC | 48% of working-age households (41% in UK) | 35% gain, 30%lose, and 35% no change (37%, 34%, 29% respectively) |
| Time limited Employment and Support Allowance | Around £22m saving in first year, lower afterwards | 8,200 claimants | 14% of ESA claimants | NI figure not available (£36 a week loss in GB) |
Source: the table draws on a range of sources; a full list can be found here: Monitoring Poverty and Social Exclusion in Northern Ireland 2014 (npi.org.uk)
The Welfare Reform Bill that has so far been delayed in NI by the Executive includes these five changes. The impact of the under-occupation penalty will be much greater in NI than GB, with 53 per cent of working-age social rent housing benefit claimants affected, compared with 23 per cent in GB. The transition from DLA to the Personal Independence Payment (PIP) will also have particular significance for NI, with almost twice the proportion claiming DLA compared with GB. Around a quarter of those reassessed in Northern Ireland are expected to lose their entitlement altogether, with a further third receiving a lower entitlement.
Conclusion
From January 2014 the Northern Ireland Executive started to incur a financial penalty of £5 million per month for not implementing the welfare reforms already in place in GB. It is not yet clear when, if, or how, any of these reforms will be enacted in Northern Ireland.
One of the advantages of having such powers devolved is that policies can be tailored to recognise Northern Ireland’s unique context. For example, the under-occupation penalty puts additional pressure on a housing allocations system that already has to reflect community divisions; the way that assessments for Personal Independence Payment (PIP) are dealt with is crucial given Northern Ireland’s higher rate of Disability Living Allowance claims for reasons of mental health (linked to the conflict).
NI has already negotiated administrative changes to Universal Credit such as fortnightly payments, more readily splitting payment between couples and direct payments to landlords for housing elements. In addition it is expected that the under-occupation penalty will only apply to new tenants, initially sparing 33,000 families. The Executive is also considering measures for the state to cover the costs of additional medical evidence required for PIP assessments (which in GB may fall on the applicant).
But in addition to these longstanding issues of mental health and community divisions, the labour market and poverty rates in Northern Ireland have been deteriorating. Welfare reforms that cut the incomes of those supported by benefits or that require more people to actively seek work – without improvements in the quality of jobs on offer – are likely to exacerbate these problems further.