Monitoring poverty and social exclusion in Scotland 2013
JRF's sixth study of poverty and social exclusion in Scotland highlights a huge rise in unemployment for under-25s, and stark and growing health inequalities.
What are the most significant poverty trends in Scotland today?
JRF's sixth study of poverty and social exclusion in Scotland highlights a huge rise in unemployment for under-25s, and stark and growing health inequalities.
Using the latest Government data, it assesses a wide range of indicators including unemployment, education, and health.
The research, carried out by the New Policy Institute, shows that:
- Since 2008, the number of under-25s who are unemployed has almost doubled to 90,000.
- Among those without dependent children, there was a rise in the number living in low-income, working families from 125,000 to 150,000
- The number of people working part-time, who want a full-time job, has risen from 70,000 in 2008 to 120,000 in 2012.
- A boy born in the most deprived 10 per cent of areas has a life expectancy of 68 – 8 years below the national average and 14 years below boys born in the least deprived areas.
Watch Darren McGarvey's speech about poverty at our launch event in Glasgow.
Summary
Key points
- In the decade to 2010/11, the child poverty rate in Scotland fell from 31% to 21% after housing costs (AHC). From having a higher rate than England and Wales, Scotland now has a much lower rate.
- Over the same period, the number of working-age adults with dependent children living in poverty fell, while the number without dependent children rose.
- Since 2008, the number of under-25s who are unemployed has almost doubled to 90,000. They are the only age group for whom unemployment has grown in the last two years.
- The number of people working part-time who want a full-time job has risen from 70,000 in 2008 to 120,000 in 2012. This has led to a rise in the number of people working part-time, while the number working full-time has fallen.
- Over the last decade, the proportion of people claiming an out-of-work benefit has fallen across Scotland from 17% to 15%. The largest falls were in Glasgow and its surrounding areas, where the rate was and remains highest, now standing at 22%.
- Health inequalities in Scotland are not only stark but growing. A boy born in the poorest tenth of areas can expect to live 14 years less than one born in the least deprived tenth. For girls, the difference is eight years.
- Rates of mortality for heart disease (100 per 100,000 people aged under 75) are twice as high in deprived areas as the Scottish average.
- Cancer mortality rates in the poorest areas (200 per 100,000) are 50% higher than average, and have not fallen in the last decade, while the average has fallen by one-sixth.
Low income
The most common measure of poverty is based on household income. A household is said to be in poverty if its income, after taxes, is less than 60% of the UK median for that year. This threshold is adjusted for household size and composition. It can also be measured before housing costs are deducted from income (BHC), or after their deduction (AHC). The latter measure is preferred here, as housing is an essential, unavoidable cost. Moreover, the BHC measure includes housing benefits, which are not disposable income – they must be paid to landlords, whether private or social.
The most recent data available is for 2010/11, which only covers the first year of the Coalition Government in Westminster. In that year, the poverty threshold was £215 a week for a couple with no children, £125 for a single adult, £301 for a couple with two young children and £211 for a lone parent with two young children.
Figure 1 – Child poverty over time in Scotland compared with England and Wales
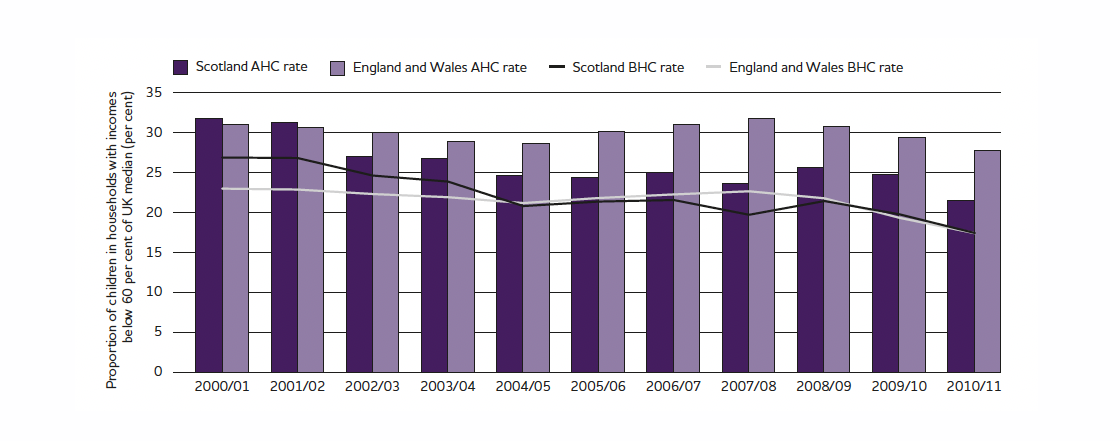
Over the last decade, child poverty in Scotland has fallen on both BHC and AHC measures. On the AHC measure, child poverty fell in Scotland too, and by much more than in England and Wales. As a result, the AHC child poverty rate in Scotland is now, at 21%, seven percentage points lower than the rest of Great Britain. A decade ago, the rate in Scotland was one percentage point higher.
This difference is mainly due to the high and rising cost of housing in England and Wales, and particularly the south of England. Among those in the bottom half of the income distribution, housing costs are 25% higher in England and Wales than Scotland. A decade ago the gap was 10%, so Scotland's lower housing costs help to keep poverty down.
The fall in child poverty in the most recent year may seem surprising, coming during a period of high unemployment. In fact, the reason why child poverty fell across the UK in 2010/11 was because the median income, against which it is measured, had itself fallen. In the UK, median income fell from £373 to £358, after taking account of inflation and housing costs. In Scotland, the fall was from £393 to £370. Any fall in poverty under such circumstances is limited cause for celebration.
Figure 2 – The number of adults in low income in Scotland over time
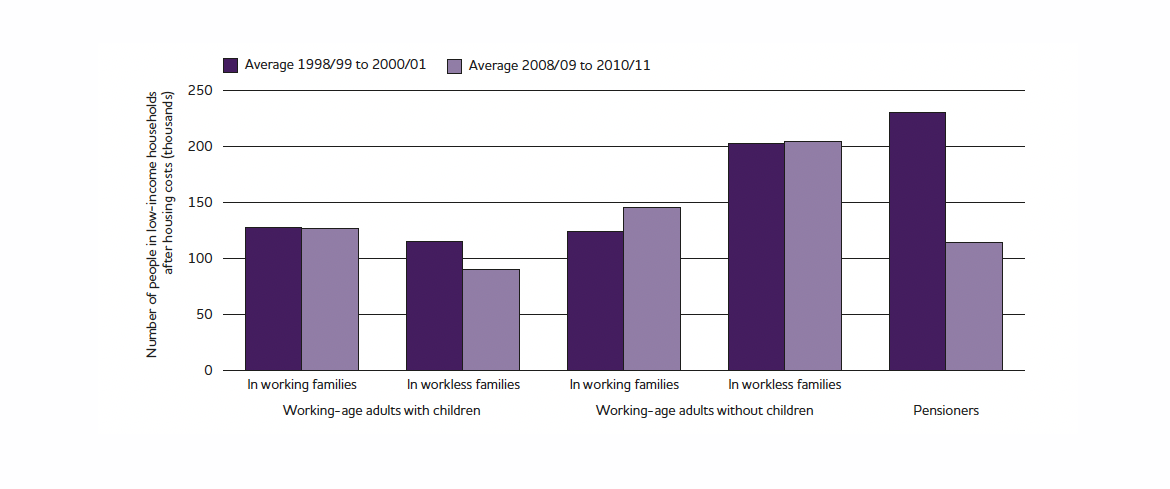
Figure 2 looks at the three years to 2000/2001 in comparison with the three years to 2010/11 using the after housing costs measure. Over that decade, the make-up of the population of adults in poverty has changed substantially. First, pensioner poverty has seen a huge fall, from 230,000 to 120,000. This fall can also be seen elsewhere in the UK.
There is a difference in the trends in poverty between working-age adults with and without dependent children. Among those with children there was no change in the number living in low-income, working families (the figure remained at around 130,000), and a fall in the number living in low-income, workless families from 120,000 to 90,000.
Among those without dependent children, there was a rise in the number living in low-income, working families from 125,000 to 150,000, and no change in the number in workless families (around 210,000).
Overall this means that the number of working-age adults in poverty remained unchanged over the decade to 2010/11, but there were changes from workless families to working families and from those with dependent children to those without.
Work and unemployment
Figure 3 – The number of people unemployed in Scotland by age
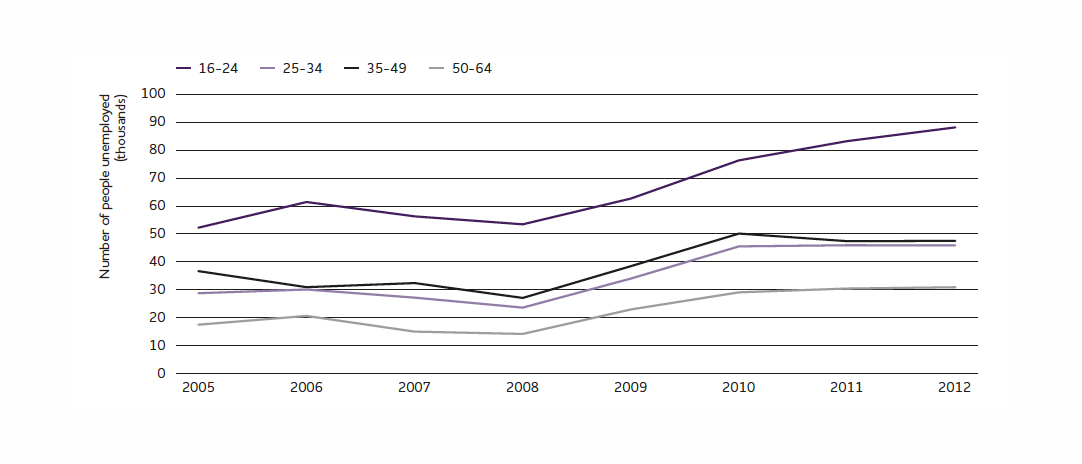
With the onset of recession in 2008, unemployment rose for all age groups. But since 2010, the only subsequent rise in unemployment has been among young adults.
By mid-2012, around 90,000 under-25s were unemployed. This amounts to an unemployment rate (unemployed people as a proportion of those either in work or unemployed) of 21%. The rate for over 25s was 6%. Both these figures were almost identical to the equivalent for England and Wales.
Rising unemployment does not tell the full story of the changes in the Scottish labour market since 2008. The total number of people in work is lower, and the mix of part-time and full-time work has changed too. The total number of people in part-time work rose by 60,000, whereas the number of people in full-time work fell by 120,000. Moreover, almost the entire rise in part-time work is among people who say they want a full-time job, from 70,000 to 120,000.
Additionally, the number of people in self-employment has risen from 265,000 to 300,000. Over the same period, the number of people in employee jobs fell by almost 100,000. All the rise is among those 'working for themselves', often people now doing similar work to that which they were previously employed by someone else to do.
Out-of-work benefits and welfare reform
Figure 4 – Proportion of adults receiving out-of-work benefits by area over time
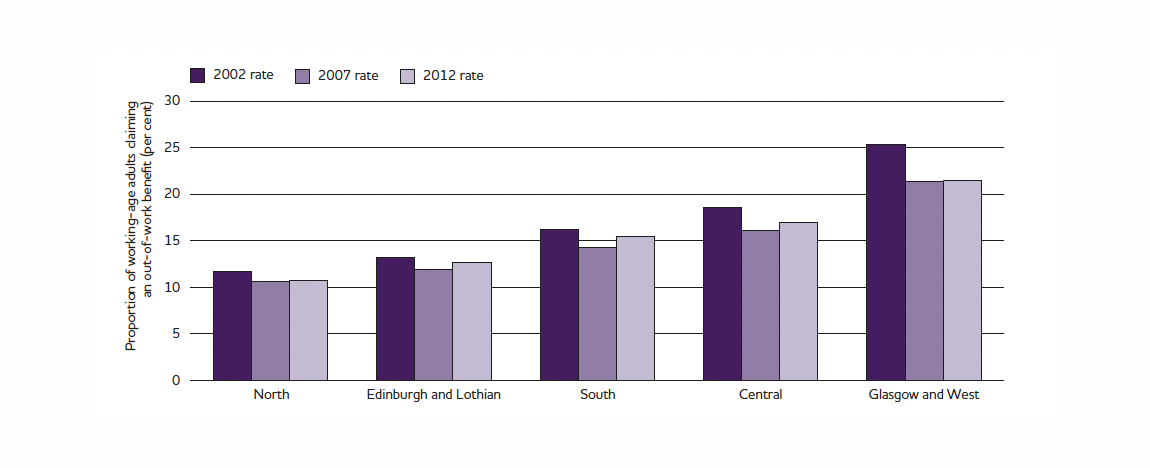
Figure 4 shows the proportion of working-age adults claiming one of the key out-of-work benefits – Jobseeker’s Allowance (JSA), Incapacity Benefit (IB), Employment Support Allowance (ESA) , Income Support (IS) or Carer’s Allowance (CA).
Moreover, since 2007, while there has been no further fall in the proportion of adults claiming these benefits in Glasgow, there has also not been a rise, whereas in most of the rest of Scotland there has been a rise.
Looking deeper into these figures, all the fall across Scotland comes from a decline in people receiving IB or ESA. This fall happened right across the last decade, though it was more pronounced in Glasgow where the proportion of people receiving these benefits was and is highest. Both in terms of numbers and rates, there were falls across all age groups.
Since 2007, all areas of Scotland have seen a rise in the proportion of people claiming JSA, but the rise in Glasgow and the West is offset by the fall in those claiming IB or ESA. This is not true in the rest of Scotland, hence the different patterns since the onset of recession.
Further reforms to the benefits system may or may not change this pattern, but they will certainly have an impact on the lives of many people in Scotland. The replacement of Disability Living Allowance (DLA) with the Personal Independence Payment (PIP), and the ensuing mandated 20% reduction in caseload will result in around 60,000 working age people in Scotland losing at least some of their entitlement (Source: Inclusion Scotland). (Welfare reform briefing, October 2012, Inclusion Scotland)
It is estimated that around 65,000 people currently claiming ESA or IB will leave the benefits system entirely due to a combination of time-limiting the benefit and increased work capability assessments (Source: Beatty and Fothergill, Incapacity Benefit Reform, the Local Regional and National Impact, Sheffield Hallam University 2011). Some may find work, and benefit reform as a whole is centred on improving incentives to do so. For those who do not, the effect is straightforward – lower incomes and deeper poverty.
Health inequalities
Figure 5 – Health inequalities by area deprivation
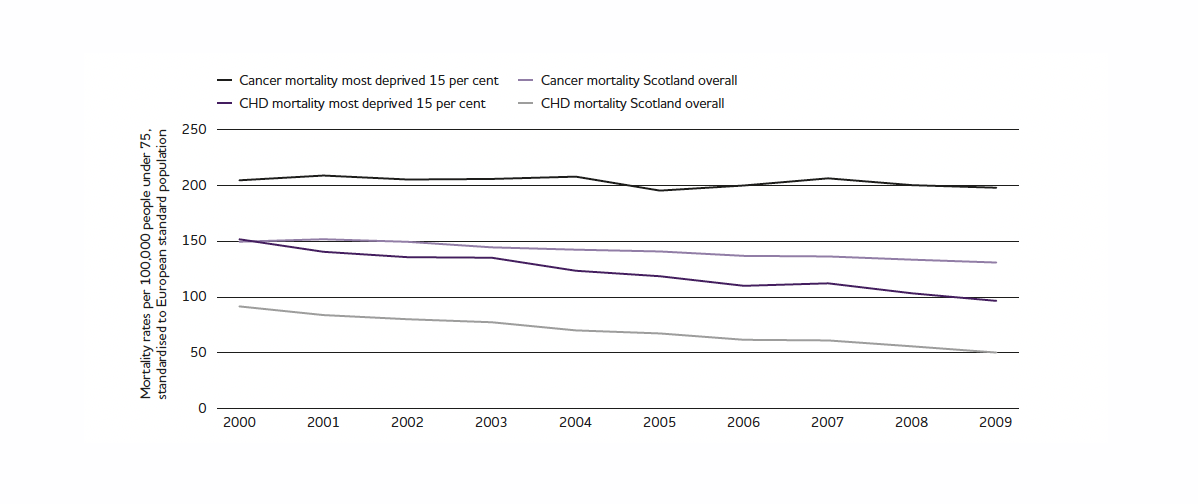
Figure 5 shows the mortality rates (adjusted for population size and structure) of coronary heart disease (CHD) and cancer. It compares these rates in the most deprived 15% of areas with the Scottish average.
Between 2000 and 2009, coronary heart disease mortality rates in the 15% of most deprived areas fell from around 150 per 100,000 aged under 75 to around 100 per 100,000. In Scotland on average, they fell from 90 to 50 per 100,000. So the fall was steeper in the more deprived areas, but the rate is now double the average.
However, this is not true for cancer mortalities. While the average fell from 150 per 100,000 aged under 75 to 130 per 100,000, the rate in the most deprived areas barely changed at all. The rate of cancer mortality is now 50% higher in the most deprived areas than the Scottish average. The difference also exists in overall life expectancy. A boy born in the most deprived 10% of areas has a life expectancy of 68, eight years below the national average and 14 years below boys in the least deprived areas. For girls born in the most deprived 10%, life expectancy is 76, four years less than the national average and eight less than girls in the least deprived 10%.
Compared with 2004 to 06, life expectancy at birth for men has increased by around one year regardless of deprivation. For women, however, while the average increased by one year, women in the most deprived 10% of areas only saw an increase of 0.75 years.
Poverty and Scottish independence
From now until the referendum in late 2014, the issue of independence will dominate the Scottish political landscape. Poverty is currently far from central to the independence debate as it stands but it is vital that it becomes so. This discussion is, after all, about the kind of country Scotland wants to be and should cover areas that are central to tackling poverty – health, schools, childcare, benefits, taxes, work and pay, services, housing and more. The Scottish Government already has powers over many of these areas.
It is important that the discussion of independence does not obscure the need for policy development in all these areas to tackle problems that will exist whatever decision the Scottish people take in 2014.
Conclusion
This Findings highlights real and growing problems – rising poverty among working-age adults without dependent children, rising numbers of people working part-time for want of a full-time job, and high young adult unemployment. They are problems that cannot wait.