What are the latest poverty trends in Wales?
This is the fourth update of Monitoring poverty and social exclusion in Wales, providing a comprehensive analysis of trends.
It examines various indicators, including:
- poverty rates in Wales;
- patterns of in-work and out-of-work poverty;
- disability and poverty; and
- employment rates
It found that:
- Wales needs job creation to defeat poverty. The extent of inactivity, disability and in-work poverty in Wales reflects weak demand for labour.
- Over the three years to 2011/12, 690,000 people (23%) were living in low-income households in Wales. The proportion in working families has risen steadily.
- 29% of people in ‘part-working’ families had low household incomes, but only 7% of those in ‘full-working’ families. For some, working more hours is part of the answer to in-work poverty.
- Some 23% of employees earning less than the UK ‘Living Wage’ had low household incomes, but only 3% of those earning more. As well as working more hours, higher pay is part of the answer to in-work poverty.
- In Wales, 26.5% of the working-age population was economically inactive in 2012 – higher than the British average by almost 3.5 percentage points, an ‘excess’ of 65,000 people. Of this ‘excess’, around 45,000 was due to the below-average employment rate in Wales
Mae'r cyhoeddiad hwn hefyd ar gael yn Gymraeg. (PDF, 352 KB)
Summary
Key points
- Over the three years to 2011/12, 690,000 people (23%) were living in low-income households in Wales. Although the total has changed little since the early 2000s, the proportion in working families has risen steadily.
- The pattern of in-work poverty across Wales differed from that of out-of-work poverty. As a proportion of their working-age populations, the West, North-West and East (predominantly rural) had high numbers receiving in-work benefits, while Cardiff had a low number. By contrast, the six South Wales Valleys had high numbers claiming out-of-work benefits.
- Some 29% of people in ‘part-working’ families had low household incomes, but only 7% of those in ‘full-working’ families. For some, working more hours is part of the answer to in-work poverty.
- Some 23% of employees earning less than the UK ‘Living Wage’ had low household incomes, but only 3% of those earning more. As well as working more hours, higher pay is part of the answer to in-work poverty. Both matter; neither is a magic bullet.
- Around 235,000 working-age adults in Wales were disabled and not in work; just over a third of them wanted paid work. Overall, 217,000 people in Wales lacked but wanted work in 2012.
- In Wales, 26.5% of the working-age population was economically inactive in 2012 – higher than in Scotland or any English region. Wales exceeded the British average by almost 3.5 percentage points, an ‘excess’ of 65,000 people. Of this ‘excess’, around 45,000 was due to the below-average employment rate in Wales.
- The extent of inactivity, disability and in-work poverty in Wales reflects weak demand for labour. Wales needs job creation to defeat poverty.
Low income in Wales
Household income is the usual measure of poverty. A household is considered to be in poverty if its income (after tax and adjusted for household size) is below 60% of the UK median for the year. This can be measured before or after deducting housing costs (BHC or AHC). Figure 1 shows households below the poverty threshold on the AHC measure, from 1994–2012, as a proportion of the population. Wales is compared with England and Scotland.
Figure 1: Proportion of people in low-income households in Wales, England and Scotland (after housing costs), 1994–2012
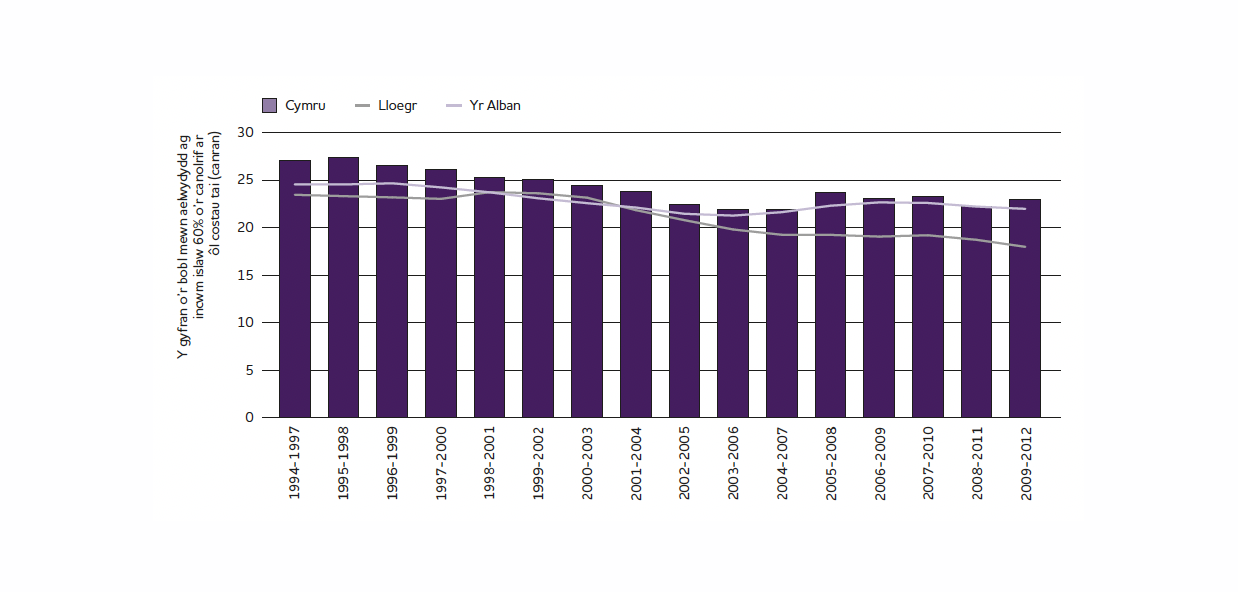
On average between 2009/10 and 2011/12, almost a quarter (23%) of people in Wales (690,000) were in low-income households, compared with 22% in England and 18% in Scotland. The figure for Wales was lower than in the mid-1990s, when it was around 27%. Since the early 2000s, the numbers and proportion of people in poverty in Wales have changed little.
Within this total, pensioners now accounted for a smaller share and working-age people a larger one. On average between 2009/10 and 2011/12, 12% of those in low income were pensioners, 29% were children and 58% were working-age adults. Ten years earlier, 19% were pensioners, 31% were children and 50% were working-age adults.
Poverty rates were slightly higher for working-age women (23%) than for men (21%). For pensioners, they were slightly higher for men (15%) than for women (13%). Some 30% of working-age adults in families containing a disabled adult were in poverty, compared with 19% of working-age adults in families with no disabled adults.
Those in working families also now formed a larger share; 44% of those in low income were adults or children in working families. Ten years earlier, they comprised 38%. The rise of ‘in-work poverty’ is in line with UK trends.
Low income in working and non-working families
As a consequence of rising in-work poverty in Wales, more working-age adults and children were now in low-income working families (285,000 on average in the three years to 2010/11) than in low income non-working ones (275,000). These two groups overlap significantly, however, with many people experiencing spells in and out of work (Tomlinson and Walker (2010) The impact of family and labour market changes on recurrent poverty). But Table 1 shows marked differences in geographical distribution of the two groups across Wales. Since headline poverty statistics are only available for all Wales, an approximation of in-work poverty is indicated by families receiving Working Tax Credits (WTC), and out of-work poverty by adults receiving out-of-work benefit.
On these measures, the West had a high share of in-work poverty (17% of WTC recipients, but 12% of working-age population). The North-West and North-East also had above-average shares. Cardiff (5% of WTC recipients, 12% of working-age population) had a low share. The contrast between the three sub-regions and Cardiff points to the rural side of in-work poverty. The geographical pattern for out-of-work poverty was completely different. The East (5% of out-of-work benefit recipients, but 7% of working-age population), North-East and North-West had below-par shares. By contrast, the South Wales Valleys (33% of benefit recipients, but only 25% of working-age population) had a high share.
| Sub-region (local authorities) | Share of all 16 to 64 year olds | Share of WTC recipients | Share of out-of-work benefit recipients |
|---|---|---|---|
| Cardiff | 12% | 5% | 11% |
| East (Powys, Monmouthshire) | 7% | 7% | 5% |
| North-East (Wrexham, Flintshire) | 9% | 11% | 8% |
| North-West (Gwynedd, Conwy, Denbighshire, Anglesey) | 13% | 17% | 11% |
| South (Newport, Vale of Glamorgan, Bridgend, Swansea) | 21% | 19% | 22% |
| Valleys (Torfaen, Blaenau, Gwent, Caerphilly, Merthyr Tydfil, Rhondda Cynon Taf, Neath Port, Talbot) | 25% | 24% | 33% |
| West (Ceredigion, Carmarthenshire, Pembrokeshire) | 12% | 17% | 11% |
Source: Population data (for mid- 2011) - Office for National Statistics (ONS) via NOMS: WTC recipients - HM revenue and Customs: out-of-work benefits - DWP via NOMS (both data for end of 2012)
In-work poverty – low pay or low hours?
Figure 2: Adults and children by family work status and income quintile
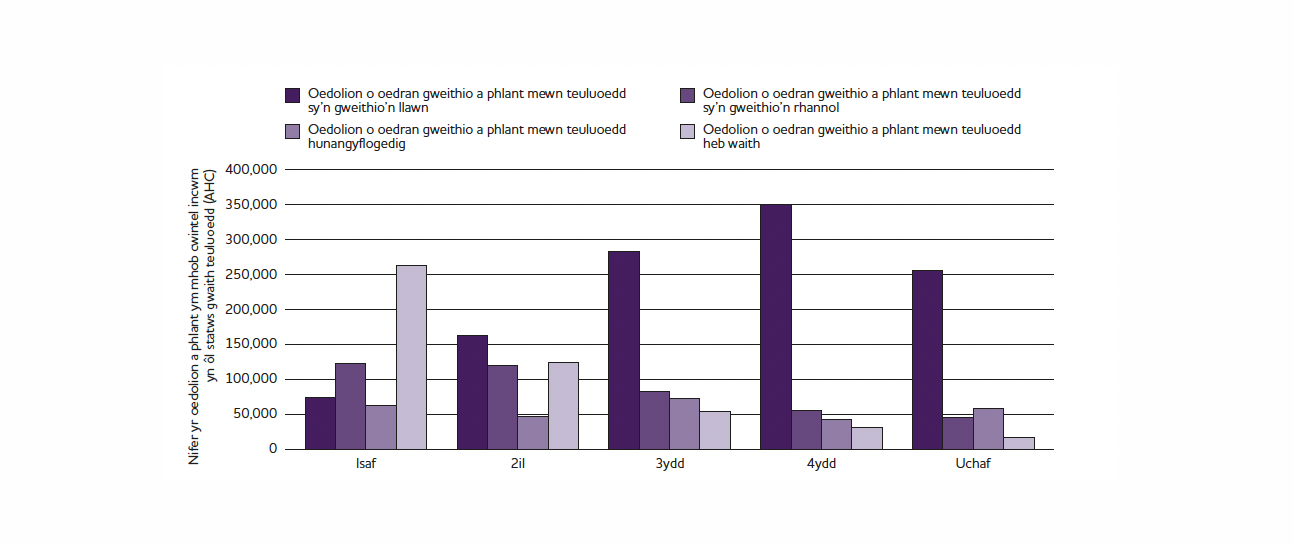
Figure 2 shows working-age adults and dependent children by family work status and quintile of UK household income distribution. With the overall poverty rate in Wales at 23%, the lowest quintile (fifth) is a suitable proxy for poverty. Some 74,000 people in full-working families (all adults working full time, or one full time and one part time) were in the lowest quintile (7% of all people in full-working families). By contrast, 123,000 people in part-working families (all adults working part-time, or one working full time and the other not working) were in the lowest quintile (29% of all people in part-working families).
This much higher risk of poverty for part-working families is often used to argue that more hours of paid work protect against in-work poverty. The social security system reflects this view by incentivising people to work more hours, through both the carrot (the 30 hours per week element for WTC) and the stick (increasing the weekly hours a couple with children must work to qualify for WTC to 24). Jobseekers who turn down a job because it is too low paid may lose Jobseeker’s Allowance for 13 weeks. The Jobs Growth Wales programme focuses on creating sustainable jobs, even at the national minimum wage.
Given the extent of underemployment in Wales (in 2012, around 19% of part-time workers wanted but could not get full-time jobs), increasing people’s working hours is both desired and desirable. But is emphasising hours to the exclusion of pay rates justified? For instance, part-time employees receive much less on average, at £7.60 an hour (the median for Wales in 2012) than full-time ones (£11.55 an hour). People in families with only part-time earners make up half of those in part-working families. For them, low pay and low hours go hand in hand.
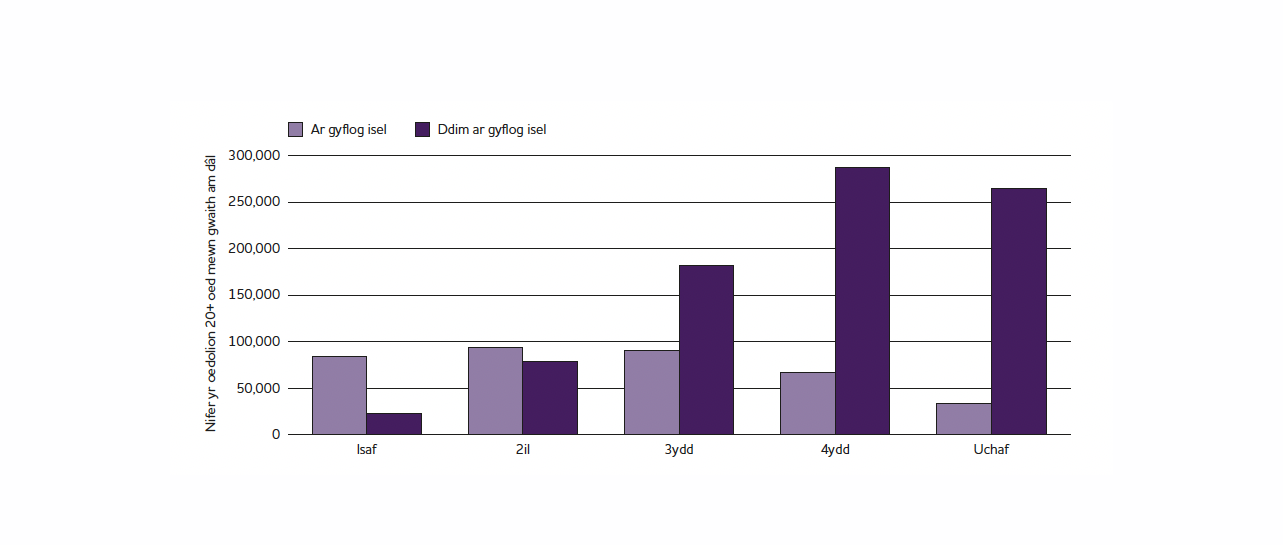
A comparison of Figures 2 and 3 shows that better pay protects against poverty as much as increased hours. Figure 2 shows that over one-quarter of people in the lowest quintile in working families (74,000 out of 260,000) are in fully-working families. Figure 3 shows that one-fifth of workers in the lowest quintile (19,000 out of 90,000) are not low-paid (with hourly wages at or above the 2011 Living Wage, deflated by earnings for earlier years).
Figure 3: Numbers of low-paid and not low-paid adults per income quintile
For someone paying income tax and national insurance and in a family receiving tax credits, 73p of every extra £1 of gross earnings goes to the UK Treasury. This applies whether the higher earnings are through longer hours or a higher pay rate (except particular thresholds of weekly hours). This high marginal deduction rate (which rises to 76p under Universal Credit for this family type) is a major disincentive against local and Wales-wide action to raise earnings in low-income households.
Some reasons for not wanting a full-time job include ill-health, disability, and child or other caring responsibilities. UK figures (2008/09 to 2010/11) suggest that 11% of low-paid part-time earners could not work more hours for these reasons, largely because of childcare responsibilities.
Low income among those furthest from the labour market
Since 2008, UK government policy has aimed to move those ‘furthest from the labour market’ into work, including replacing Incapacity Benefit (IB) with Employment and Support Allowance (ESA) and reducing the age of the youngest child after which lone parents are required to seek work. From the data analysed for this review, disability was the main distinguishing factor among half of low-income working-age adults not in working households. Of those in out-of-work poverty, 47% were disabled, 19% were lone parents and 28% were unemployed.
UK welfare reforms impacting on disabled people have hit Wales the hardest. With the transition from IB to ESA, the loss by 2014/15 will be £165 per working-age adult. The average loss through replacing Disability Living Allowance with the Personal Independence Payment is £55 (Beatty and Fothergill (2013) Hitting the poorest places hardest). This reflects Wales’s higher rate of disability, with around 24% of the working-age population reporting a disability, compared with 20% in England. Overall, half of all workless, working-age adults in Wales are disabled.
Disability and economic inactivity
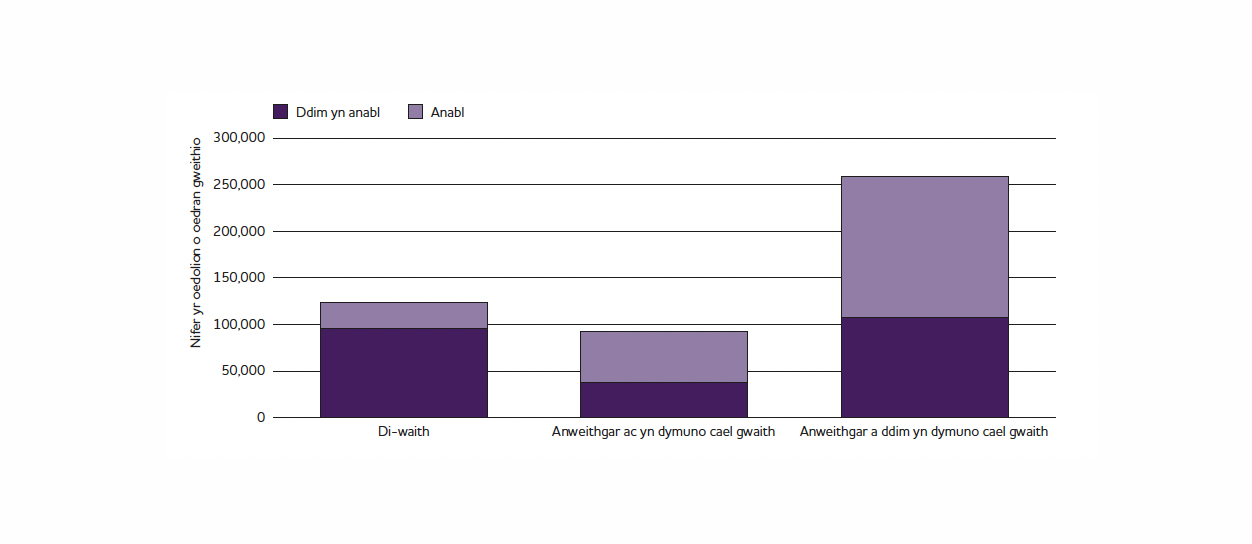
Whether disability is an indicator of distance from the labour market depends on how distance is measured. Figure 4 shows the 475,000 working-age adults (excluding students) in Wales not in paid work (2012) according to whether they wanted work and, if they did, whether they met the conditions to count as unemployed (actively seeking work and ready to start) and therefore ‘economically active’. Just under half (235,000) of this total were disabled.
Government policy has been to try to move people from economic inactivity to activity. Only a quarter of unemployed people (28,000 out of 124,000) were also disabled, but seven in eight disabled people not in work were ‘inactive’. Alongside those 28,000 unemployed people, a further 55,000 disabled people were ‘inactive’ but wanted paid work. These 83,000 represented more than one-third of all disabled working-age people not in paid work, and almost 40% of all those in Wales who wanted paid work (217,000 in 2012). While better support for people to find suitable jobs is good, the punitive aspects are unnecessary, given how many disabled people already want paid work.
The 26.5% economically inactive working-age population in Wales was higher than any English region or Scotland. Wales exceeded the British average by almost 3.5 percentage points, an ‘excess’ of 65,000 people. The employment rate influenced this level of inactivity. Wales had the UK’s second lowest employment rate, after the English North-East. What matters, however, is whether Wales has a higher inactivity rate given its lower employment rate. Statistical analysis showed that it does – but only by about 20,000 people. If Wales had an average employment rate, economic inactivity would be 45,000 lower.
Figure 4: Non-working, working-age adults in Wales by i) economic activity status and ii) wanting a job
Policy implications
The importance of job creation
The main problem in Wales is lack of jobs. Unemployment accounts for only 60% of those lacking but wanting work. Welfare reform is a supplement to job creation aimed at full employment, not a substitute for it. The priority of economic policy over welfare reform may also apply to in-work poverty. Research from the US has shown that when labour demand picks up strongly, those working too few hours for too little pay have seen both improve. This is supported by evidence for Wales that from a poverty perspective there is no reason to favour ‘more hours’ over ‘higher pay’ (or vice versa). Both have a role, though the Welsh Government’s updated Action Plan only mentions the former (Building resilient communities: taking forward the Tackling Poverty Action Plan (2013)).
Mitigating poverty’s impact
Jobs will be scarce in Wales for a long time. The Action Plan’s ‘mitigation’ heading recognises this. Its subjects – health, housing, financial advice and digital inclusion – could be added to (e.g. transport). But bigger questions include whether mainstream public services figure sufficiently within the plan. A move in this direction acknowledges the problem of the ‘inverse care law’ – those areas needing the highest quality medical and social care get the worst. The plan contains an Inverse Care Law Programme. Another question is whether some unifying idea would strengthen the approach. Given that low-income working families may lack time as well as money, one idea could be to test public services against their needs.
In practice, mitigation has also extended to the welfare cuts’ financial effects. Keeping part of the Education Maintenance Allowance and absorbing the cut in Council Tax Benefit (CTB) are examples of very well targeted spending in Wales. Recipients of such measures are on extremely low incomes (as low as £72 a week for singles or £113 a week for couples). For them, seemingly small sums of money (e.g. the almost £3 a week average council tax ‘hit’ in England for those losing full CTB) make a big difference.