Analysis of the latest data on poverty in the UK.
This annual report by the New Policy Institute gives a comprehensive picture of poverty in the UK, featuring analysis of low income, unemployment, low pay, homelessness and ill health.
A focus on the geographical distribution of disadvantage reveals that national averages mask huge variations between areas in unemployment, educational achievement, and life expectancy. The research shows that:
- more than half of the 13 million people living in poverty in the UK in 2011/12 were in a working family;
- while the labour market has shown signs of revival in the last year, the number of people in low-paid jobs has risen and average incomes have fallen – around five million people are paid below the living wage;
- there is substantial movement in and out of work – 4.8 million different people have claimed Jobseeker’s Allowance in the last two years;
- the proportion of pensioners in poverty is at its lowest for almost 30 years, but the proportion of working-age adults without children in poverty is the highest on record.
Summary
Key points
- In 2011/12, 13 million people in the UK were living in poverty. For the first time more than half of these people lived in a working family.
- The proportion of pensioners in poverty is at its lowest for almost 30 years. The proportion of working-age adults without children in poverty is the highest on record.
- Average incomes have fallen by 8 per cent since their peak in 2008. As a result, around 2 million people have a household income below the 2008 poverty line but are not considered to be in poverty today.
- In the last year, the labour market has shown signs of revival. Underemployment has fallen slightly from 6.4 million to 6.3 million and young adult unemployment appears to have peaked at 21 per cent.
- The number of people in low-paid jobs has risen. There are now around 5 million people paid below the living wage.
- The movement in and out of work is substantial – 4.8 million different people have claimed Jobseeker’s Allowance (JSA) – in the last two years.
- Following recent changes to the social security system, many people on means-tested benefits have reduced incomes. Around 500,000 families face a cut in housing benefit via the under-occupation penalty and a reduction in Council Tax Benefit. The number of sanctioned jobseekers with a reduced entitlement to JSA doubled in 2010 to around 800,000.
- The level of benefits for an out-of-work adult without children now covers only 40 per cent of what the public considers to be a minimum standard of living. For families with children this figure is no more than 60 per cent.
- National averages mask huge variations between areas in unemployment, educational achievement, and life expectancy.
Background
This study looks at measures of low income, deprivation and other types of disadvantage. Low income (or poverty) is defined as people living in households with income below 60 per cent of the median for that year. In the last two years, median income has fallen substantially, a fall that itself affects the number of people in poverty.
The most widely used measure of poverty is based on household income. A household is considered to be in poverty if its income, after taxes have been paid, and adjusting for the household size and composition, is below 60 per cent of the national median that year. As the median income rises, the amount of money required to be above the poverty line rises. As median income falls, so does this threshold. Median incomes in the UK in 2011/12 are now, in real terms, just below what they were in 2001/02 (£367 a week compared with £368). From their 2007/08 peak, they have fallen 8 per cent. This means that people may be no better off, but rather the poverty line has fallen from above their income level to below it.
This has been the experience for around 2 million people, whose incomes mean they would have been in poverty under the 2007/08 poverty line, but are considered not to be in poverty in 2011/12. The recent flat trend in relative poverty should be viewed in this context.
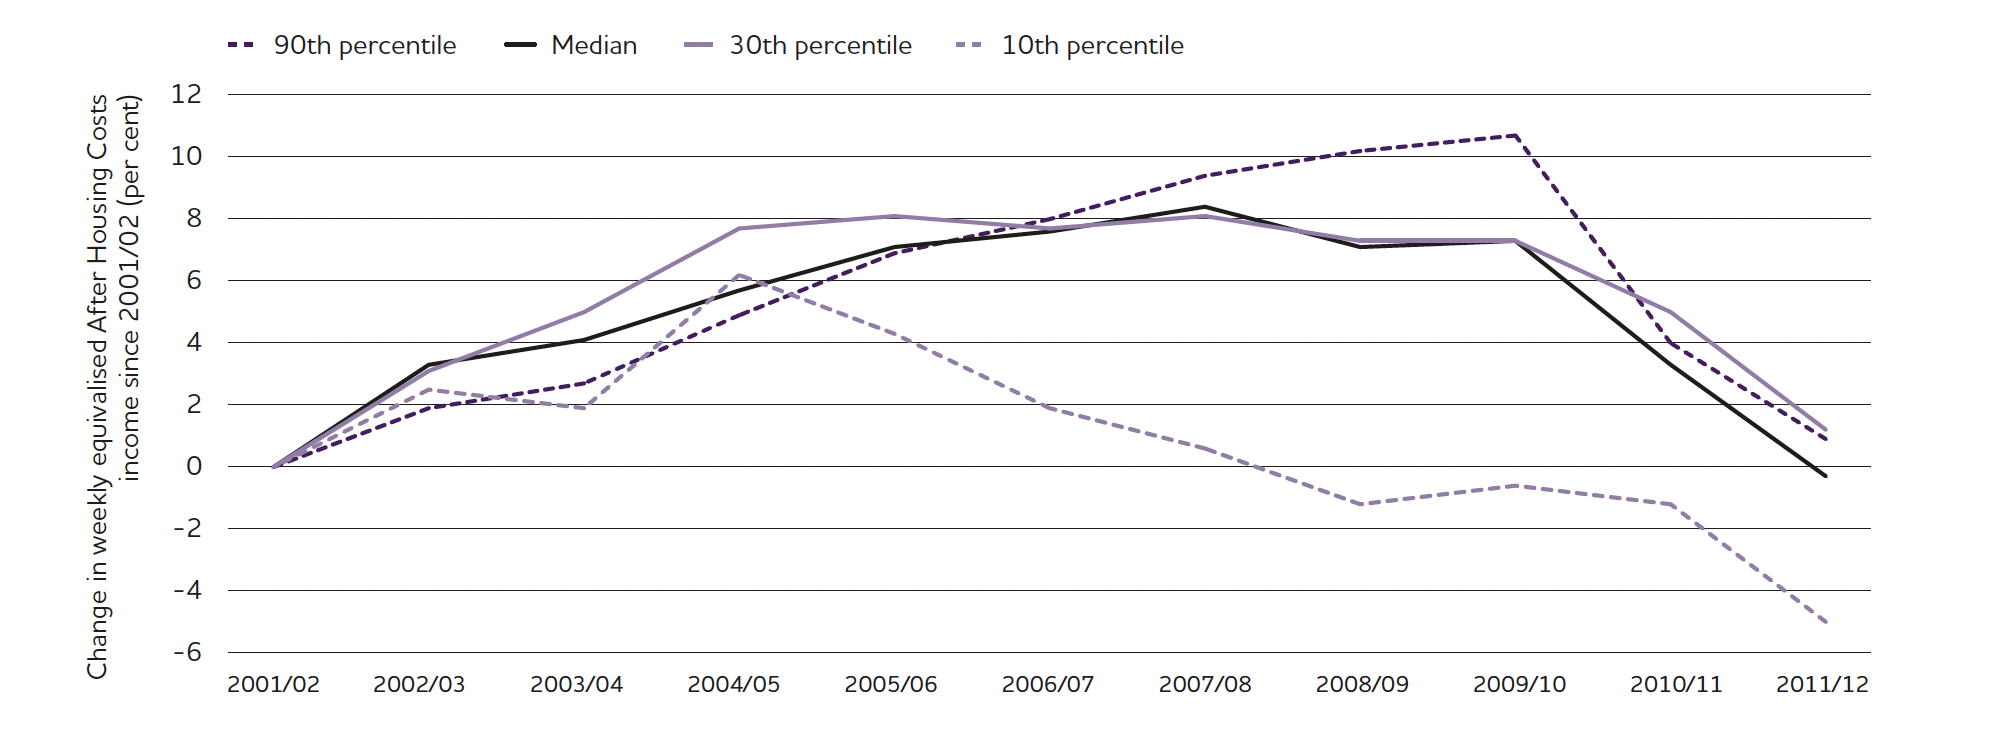
Incomes at different points of the distribution have changed at different rates over the ten years to 2011/12. Income at the 10th percentile is now 5 per cent lower in real terms. For people at this point in the distribution, income has been declining in real terms since 2004/05. At other points in the distribution, incomes are around the same level now as at the start of the 2000s, having risen until 2008 and fallen steeply thereafter. Since the recession began, those at the bottom of the distribution have seen a smaller fall, but this obscures the fact that their incomes had been falling for longer.
Changing poverty rates
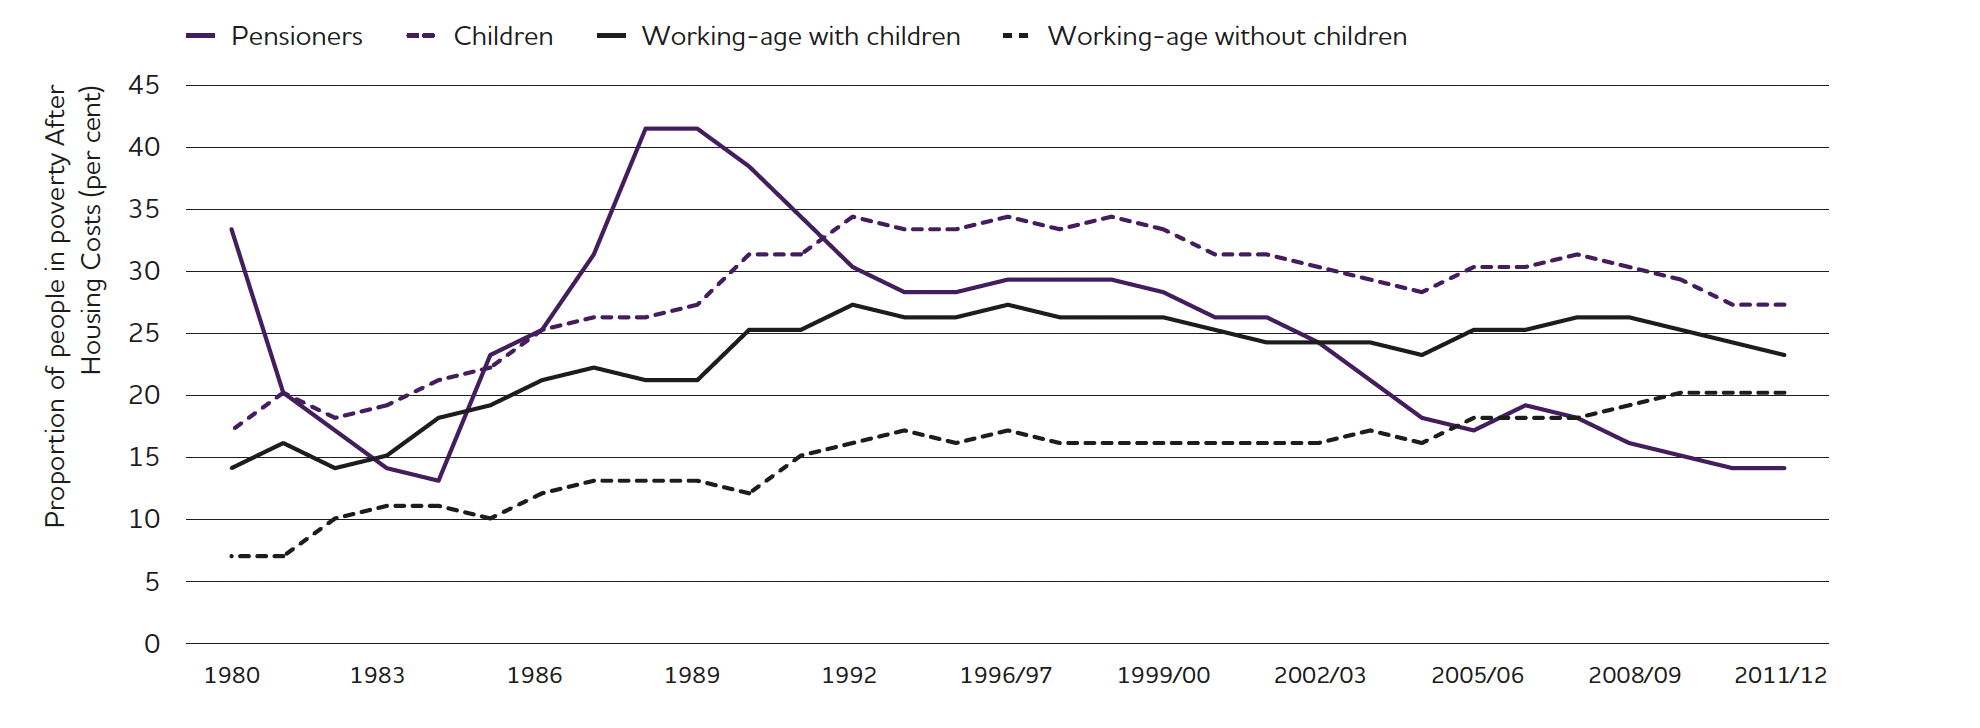
The proportions of different groups of people in poverty have changed over the last 30 years, with corresponding changes to the composition of poverty. In 2011/12, the proportion of pensioners living in poverty had fallen to 14 per cent, its lowest rate for almost 30 years. Child poverty has fallen to 27 per cent, its lowest rate for almost 25 years. At the same time, poverty among working-age adults with children remains at 23 per cent, broadly in line with the previous few years.
Among working-age adults without dependent children, the proportion living in poverty is now 20 per cent. This is the highest in at least 30 years, having risen quite steadily over that period. Uniquely, poverty among this group did not fall when median incomes fell.
These changes become even more apparent when we consider the composition of those in poverty. In 1982, there were similar numbers of children, pensioners and working-age adults (with or without children) living in poverty. Even as poverty rose in the next ten years, the distribution across age groups remained broadly similar – 4 million children, 3 million pensioners, 3 million of working-age adults both with and without children.
By 2012, however, this has changed completely. There are now around 3.5 million children in poverty, 3 million parents, 1.5 million pensioners and 4.5 million working-age adults without children. So despite parents having a greater risk of poverty, there are many more non-parents living in poverty.
There are other big shifts in terms of work status and tenure of people in poverty. For the first time in the data series, there are more people in poverty in working families than in workless working-age and retired families combined. The number of people in poverty in the social rented sector is 1.5 million lower than a decade ago at 4.2 million people. The number in the private rented sector is 1.7 million higher, now standing at 3.9 million.
Labour market turnaround?
For the last few years, the indicators in this report relating to the labour market have deteriorated year on-year. This year, there are signs of improvement or, at least, no further worsening.
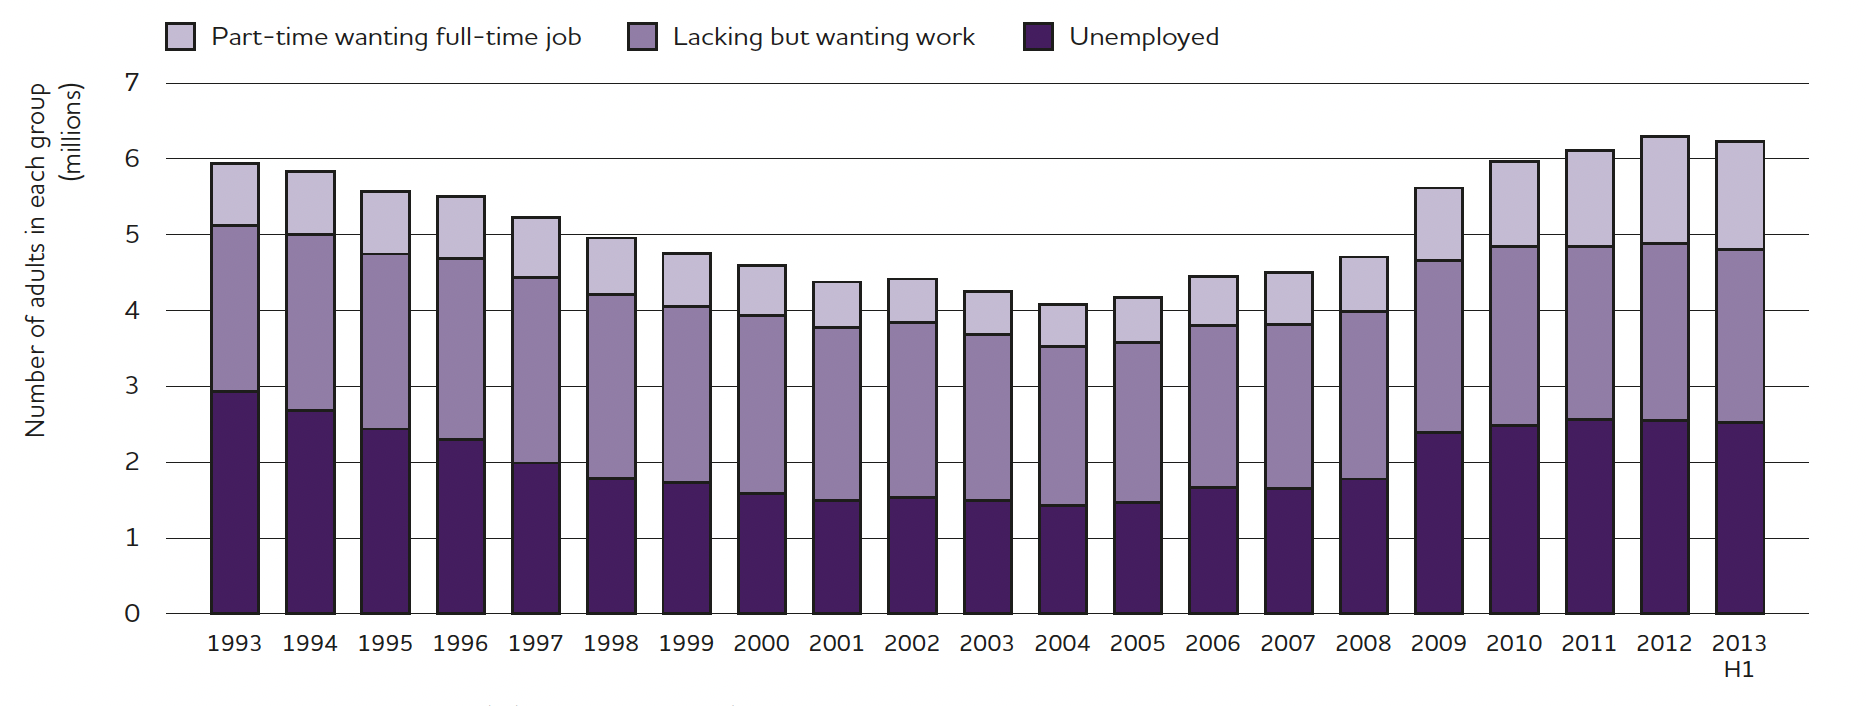
In the first half of 2013, around 6.2 million people were underemployed. Of these, 2.5 million were unemployed, 2.3 million inactive but wanting work, and the remaining 1.4 million working part-time but wanting to work full-time. This year is the first since 2003 where there has been any sort of fall in the underemployment total (around 100,000), though it remains at a historically high level.
The increase in underemployment since the recession began has been driven primarily by higher levels of unemployment and those working part-time but wanting to work full-time. Both these figures stopped rising in 2013.
The number of people employed on a temporary contract but who want a permanent contract has fallen slightly since 2012, after rising steadily since 2008. There were around 625,000 people in this position in the first half of 2013. The number of people working on zero hours contracts increased by 50,000 between 2011 and 2012 while the average number of hours worked on such contracts fell.
On the indicators relating to low-paid jobs, however, there is little sign of improvement. Between 2011 and 2012, the proportion of female employees who were low paid increased. Some 27 per cent of female employees are now paid below the living wage of £7.40 per hour. The proportions that are low paid are still lower for both men and women than in the early 2000s. Full-time real earnings for men and women have fallen since 2007 at all points in the earnings distribution, for part-time and full-time employees, though they remain higher than in 2002.
This prevalence of low pay inevitably affects the level of poverty. Over half of adults in working families in poverty are paid below the living wage, once self-employed people are excluded.
Education and the London success story
Coming from a low-income background in London is less of an impediment to academic attainment and continuing education than it is in the rest of the country. London has the lowest proportion of schools falling below the GCSE ‘floor standard’ of any English region, at slightly over 2 per cent (the next lowest is the South West at just over 4 per cent). Children on free school meals in London are far more likely to get five good GCSEs than children elsewhere. London has the 13 local areas with the best GCSE performances for children on free school meals.
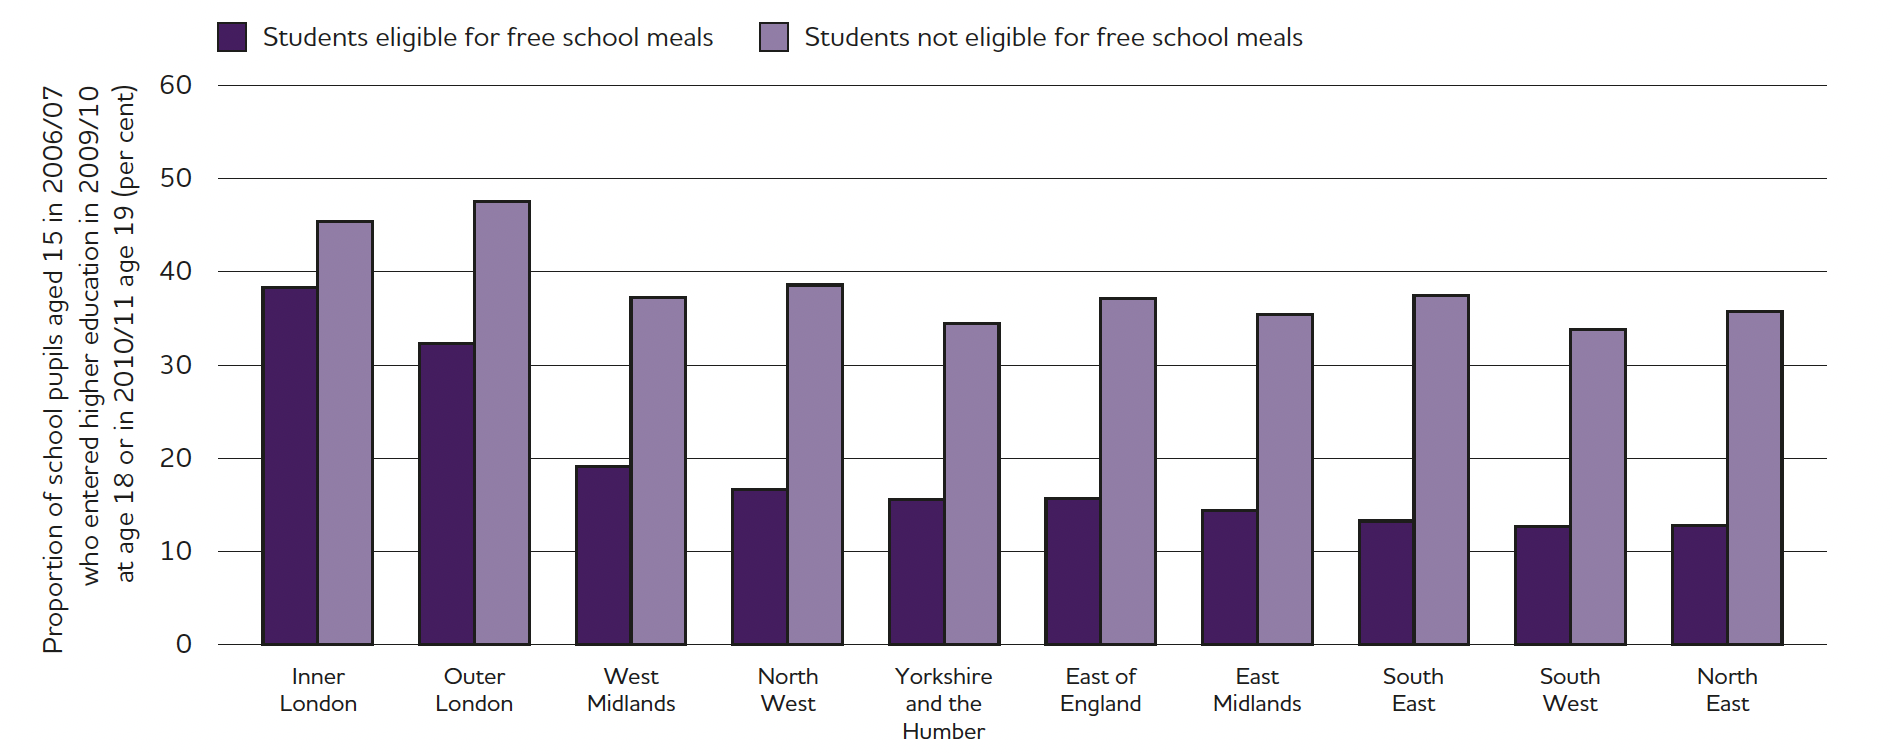
Almost 40 per cent of children in Inner London that were eligible for free school meals entered higher education at age 18 or 19 and over 30 per cent in Outer London. In the case of Inner London, this is very close to the proportion of students who did not get free school meals and went on to higher education. In no other region did the proportion exceed 20 per cent.
However, educational standards have been improving steadily for a number of years. The proportion of pupils at both Key Stage 2 and 4 not meeting the expected standards has fallen. For example, the proportion not attaining five good GCSEs at age 16 fell from 79 per cent to 64 per cent for those eligible for free school meals between 2006/07 and 2011/12, and from 50 per cent to 37 per cent for those not eligible.
Despite improvements, there are still areas of concern. The attainment gap between pupils on free school meals and those not has remained constant. Eighty-five per cent of looked-after pupils failed to attain five good GCSEs in 2012, compared with 40 per cent of all pupils. In addition, 37 per cent of care leavers are not in employment, education, or training.
Geography of disadvantage
Poverty and disadvantage in the UK are not evenly spread across the country. This year’s report includes a map in each chapter to capture an aspect of this geography. The patterns vary across different indicators.
Child poverty tends to be a problem for urban centres of various sizes, with high levels in parts of London and Manchester but also smaller towns such as Hastings and Strabane. Unemployment rates are particularly high in the North East of England, with 11 out of 12 local authorities there having an unemployment rate greater than 9 per cent. There are, however, areas of high unemployment in every part of the country.
In education, London tends to perform best regarding high rates of students on free school meals who achieve five good GCSEs. The worst performing regions on this indicator are the South West, and Yorkshire and the Humber.
Rates of claiming an out-of-work benefit are highest in councils in Northern Ireland, where four councils have more than 25 per cent of the working-age population claiming. Wales and parts of the North of England also have high rates of people receiving an out-of-work benefit. Levels of housing benefit claims are highest in London, parts of Wales and North East.
Inequalities in male life expectancy have a north-south divide. Of the ten local authorities where male life expectancy is below 75, seven are in Scotland and the remaining three are in the North West. Almost every single local authority where male life expectancy is over 81 is in the south of England.
Conclusion
The findings in this study are not all negative. The labour market has been stronger in 2013 than a year ago, with both unemployment and the broader underemployment measure falling. The headline measure of the number of people living in poverty fell as well.
But while the fall in unemployment is clearly a positive development, we must be much more qualified about the fall in the number of people in poverty. The second consecutive annual fall in average incomes, against which the poverty threshold is set, is unprecedented, and means that substantial numbers of people just above the current poverty line are worse off than they were five years ago. Since these figures were collected (in 2011/12), there have been further falls in real wages and the real value of benefits.
This broadening of poverty is happening at the same time as the experience of poverty, for some people, gets more severe. Increasing numbers of people are now living on incomes below the value of out-of-work benefits (which themselves are worth far less than the poverty line). They include the rising number of jobseekers being sanctioned, private renters facing stricter caps on Local Housing Allowance, social renters paying the bedroom tax, and low-income families paying Council Tax from which they were previously exempt.
Previous reports in this series have pointed out the mistake of focusing on welfare reform as the solution to poverty. This study has shown how changes to the welfare system have made poverty worse. The small, positive developments in the labour market cannot in any way be seen as ‘balancing’ reforms that have cut the incomes of some of the poorest people in the country.