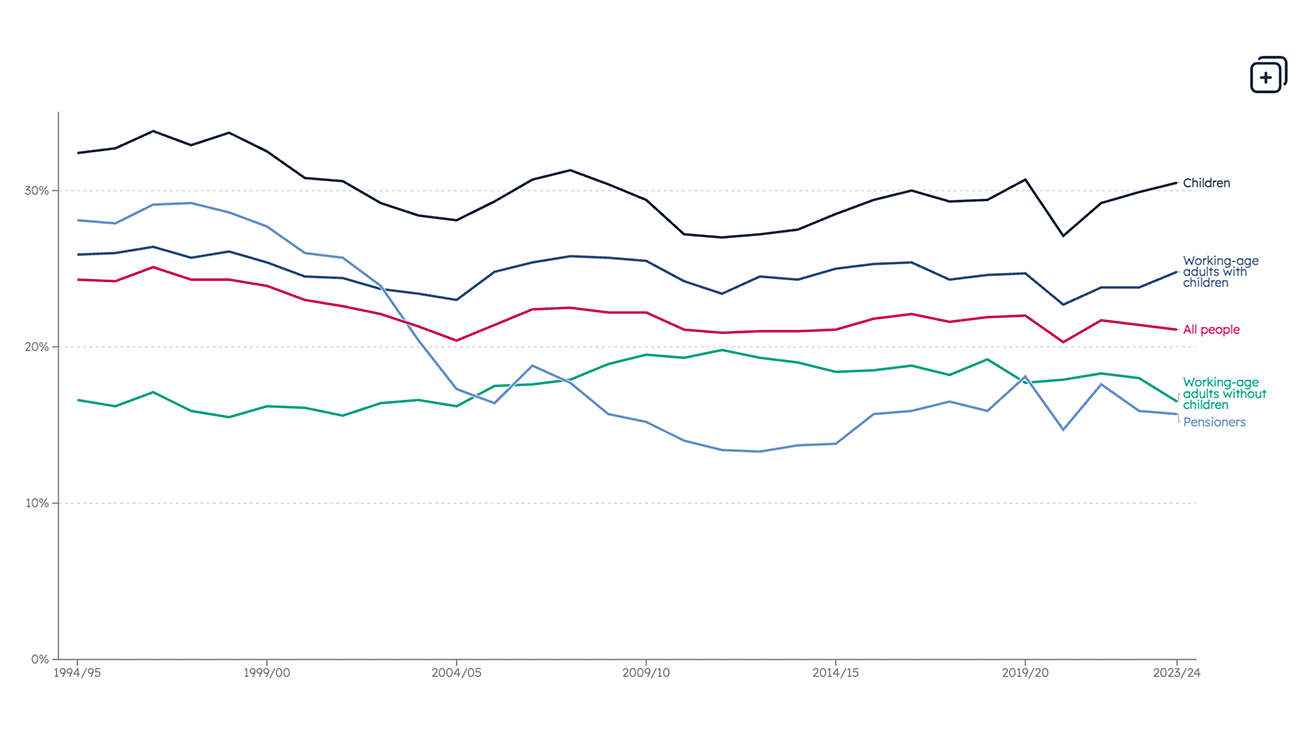
Data Overall poverty rates for children, working-age adults and pensioners Our latest data charts show clear differences in poverty rates across age groups, with children and people in lone-parent families at highest risk.
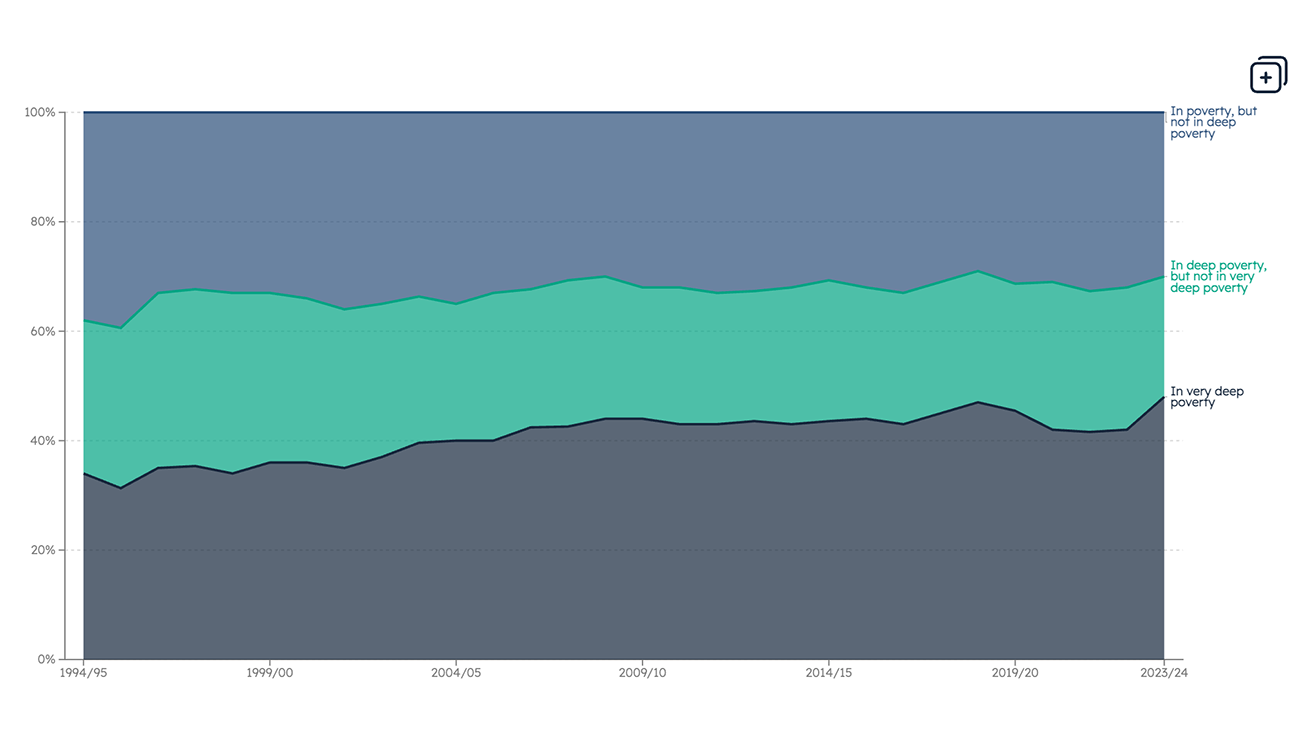
Data Depth and duration of poverty Our latest data charts show longer and deeper experiences of poverty lead to more severe hardship, with rising numbers of people now in very deep poverty.
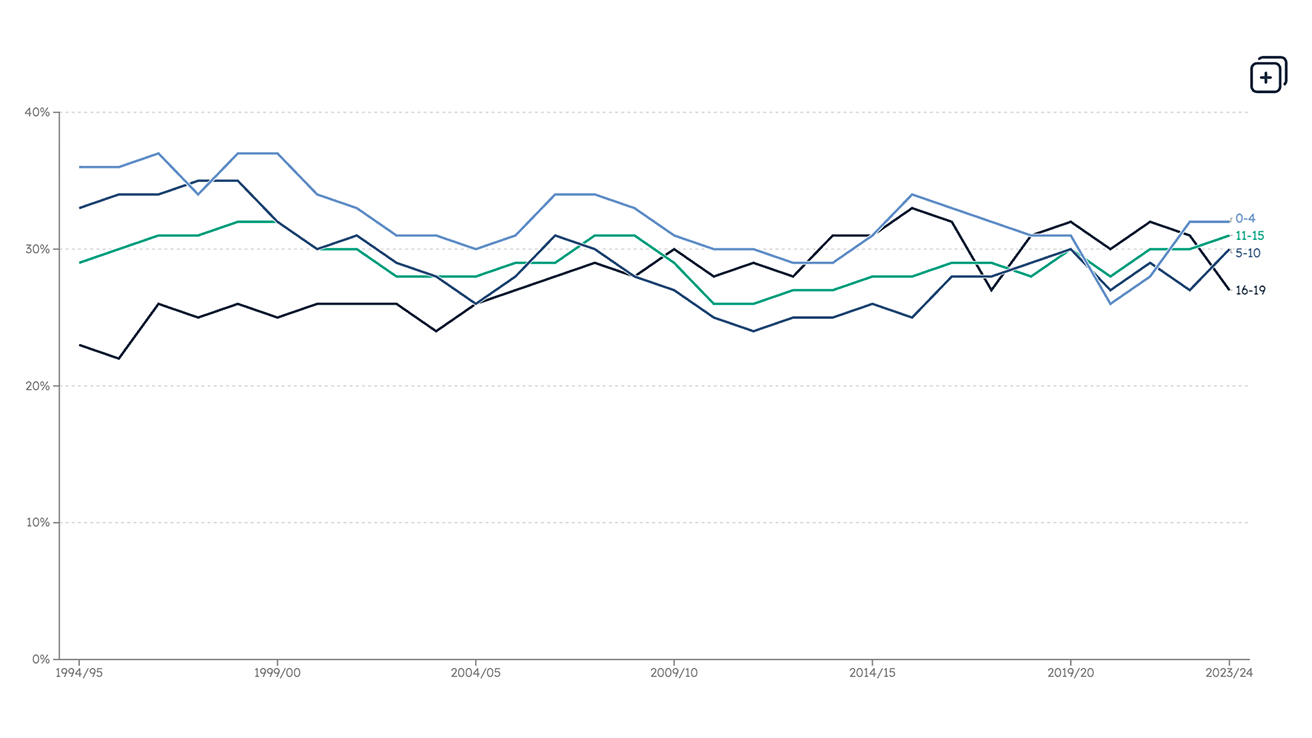
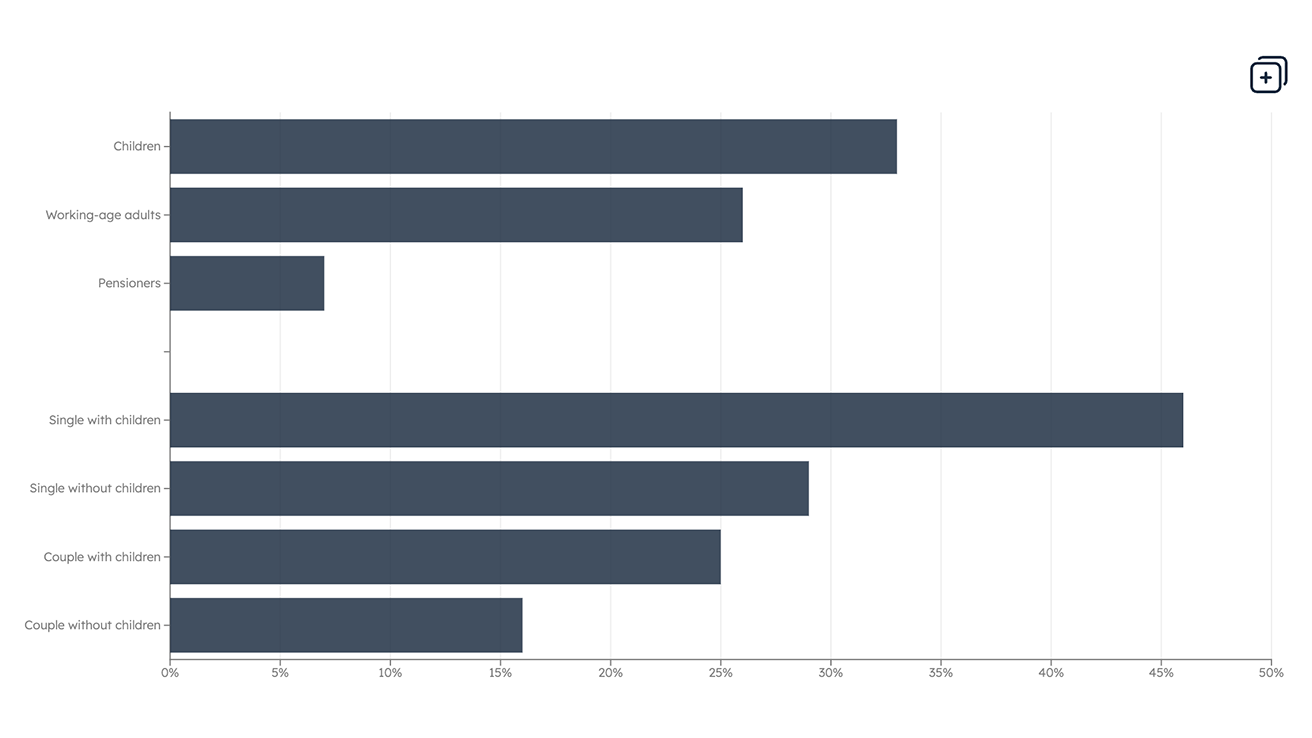
Data Family composition, age and sex Our latest data charts show poverty risks vary by family type, age and sex, with children, lone-parent families and younger adults facing the highest rates of poverty.
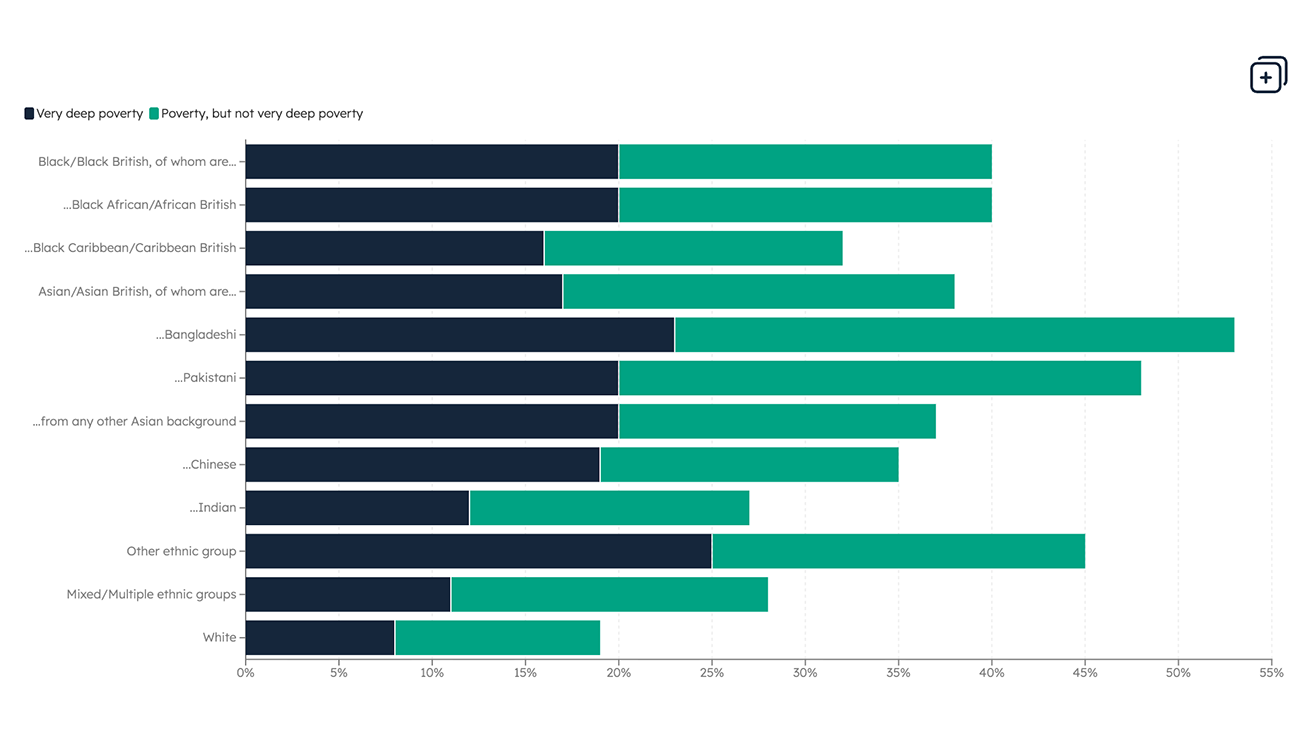
Data Ethnicity Our latest data charts show poverty rates differ sharply by ethnicity, with many minoritised ethnic groups far more likely to experience poverty and very deep poverty.
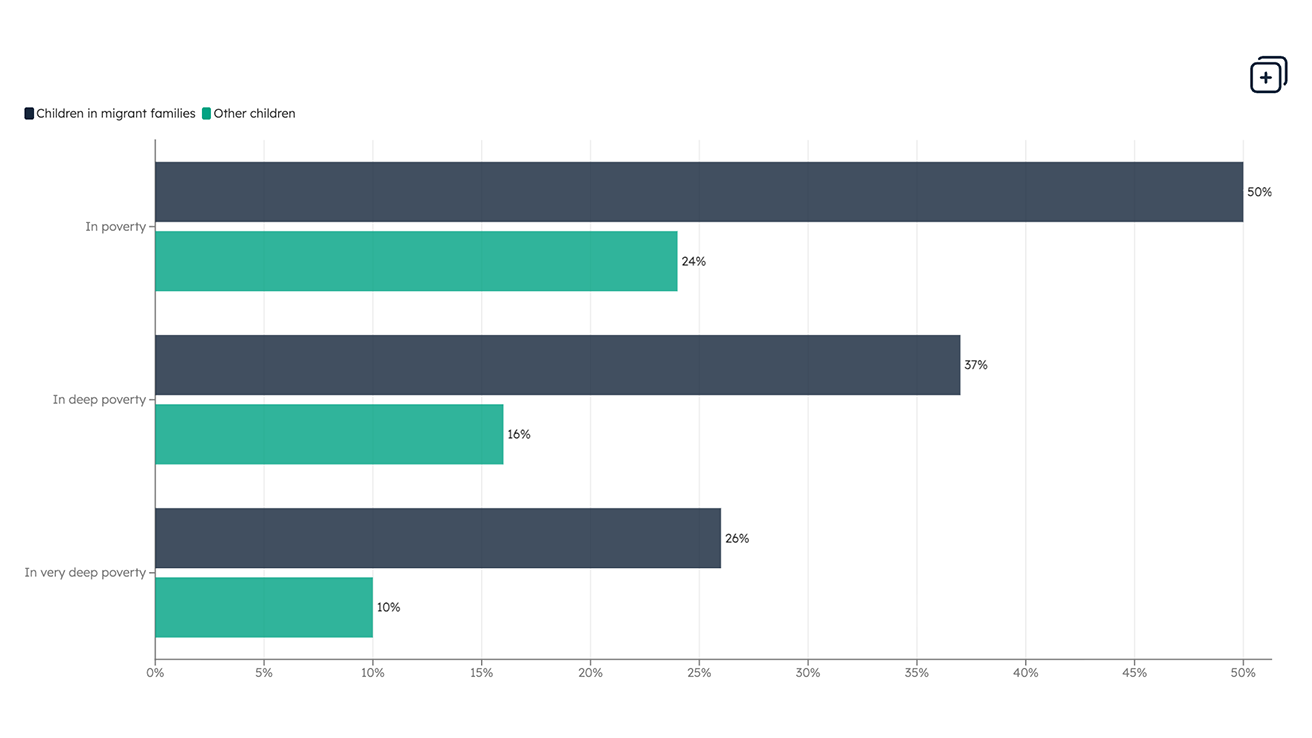
Data Migrant families Our latest data charts show children in migrant families face much higher poverty rates than other children, even when their parents are in work.
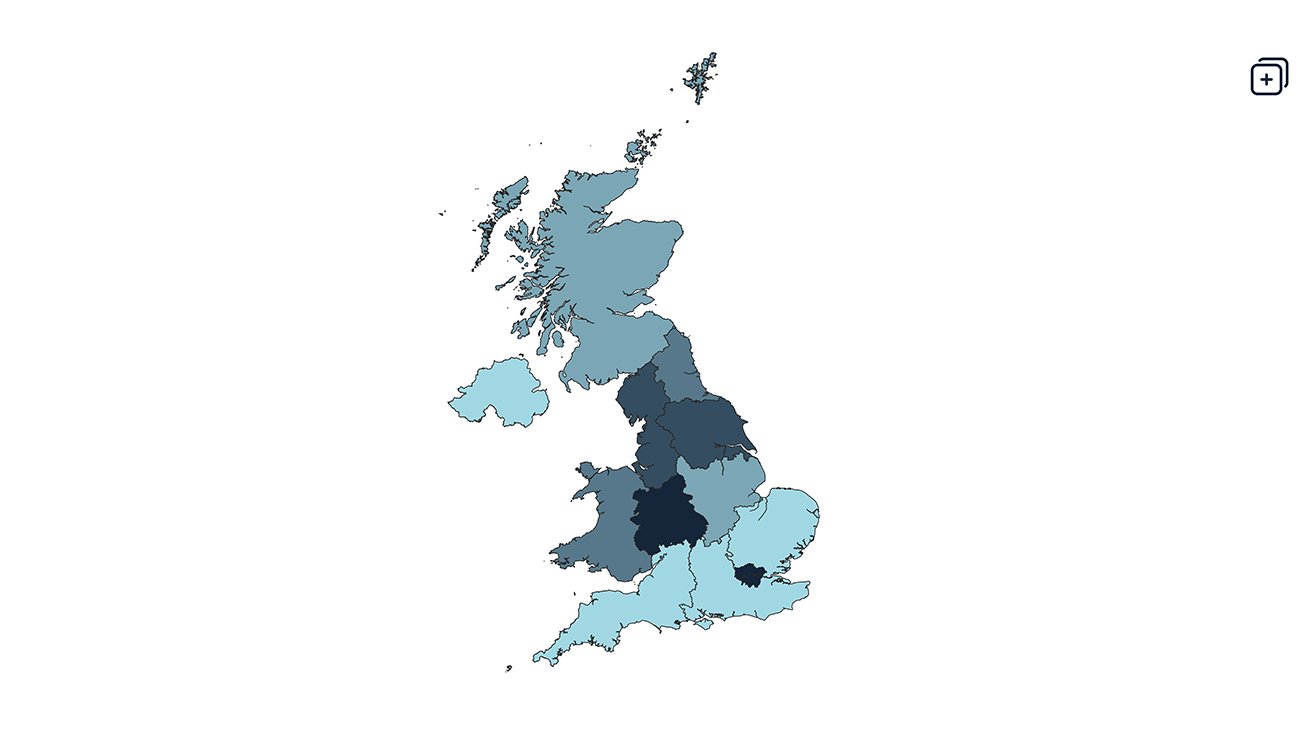
Data Geography Our latest data charts show poverty rates vary widely across the UK, reflecting local differences in labour markets, housing costs and access to services.
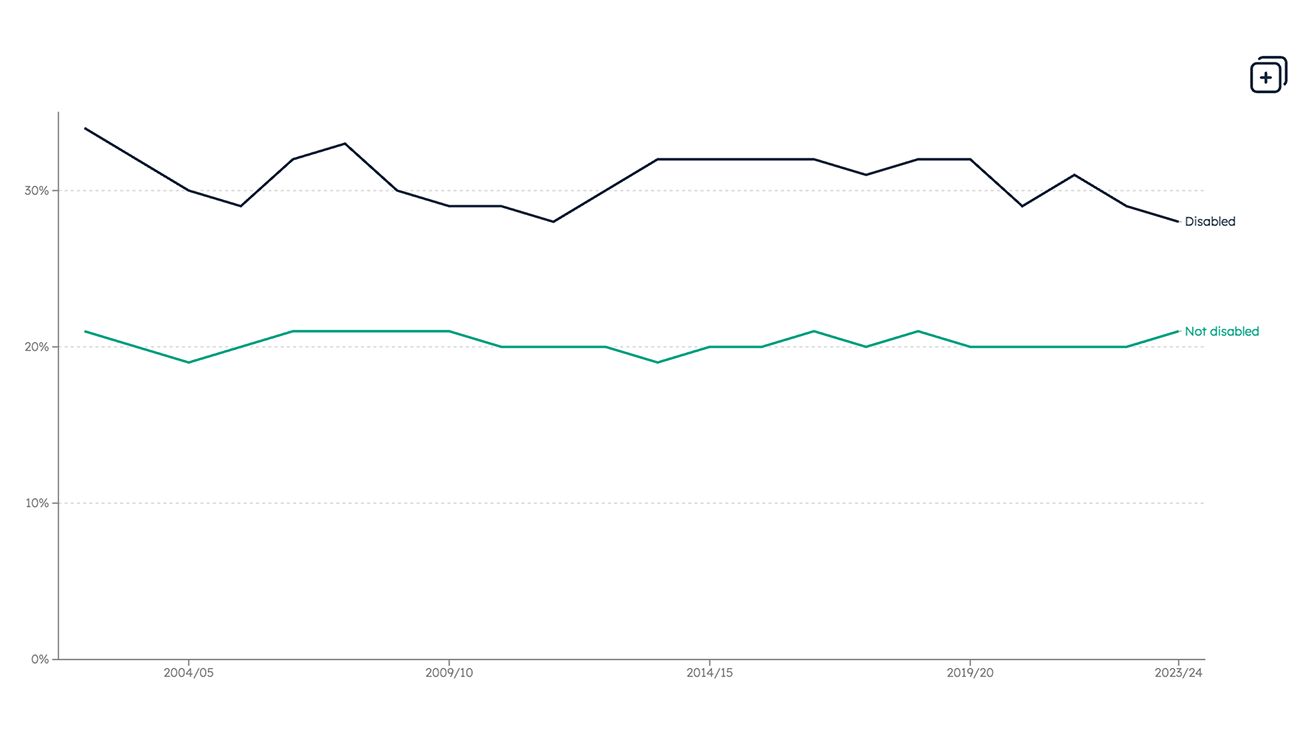
Data Disability Our latest data charts show disabled people are far more likely to live in poverty, driven by extra costs, barriers to work and inadequate income support.
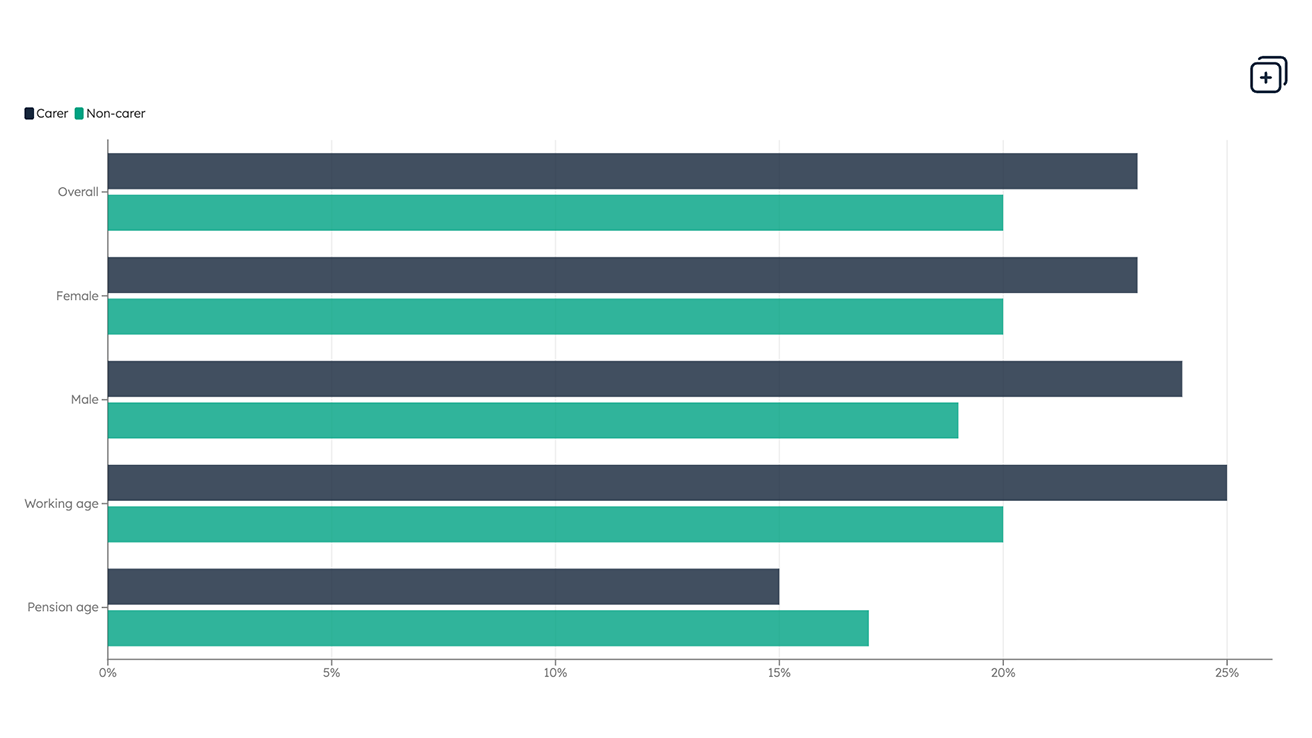
Data Carers Our latest data charts show carers are more likely to live in poverty, as balancing paid work with caring responsibilities often brings lower incomes and extra costs.
Data Work Our latest data charts show work does not guarantee protection from poverty, as low pay, insecure jobs and limited hours leave many workers struggling to make ends meet.
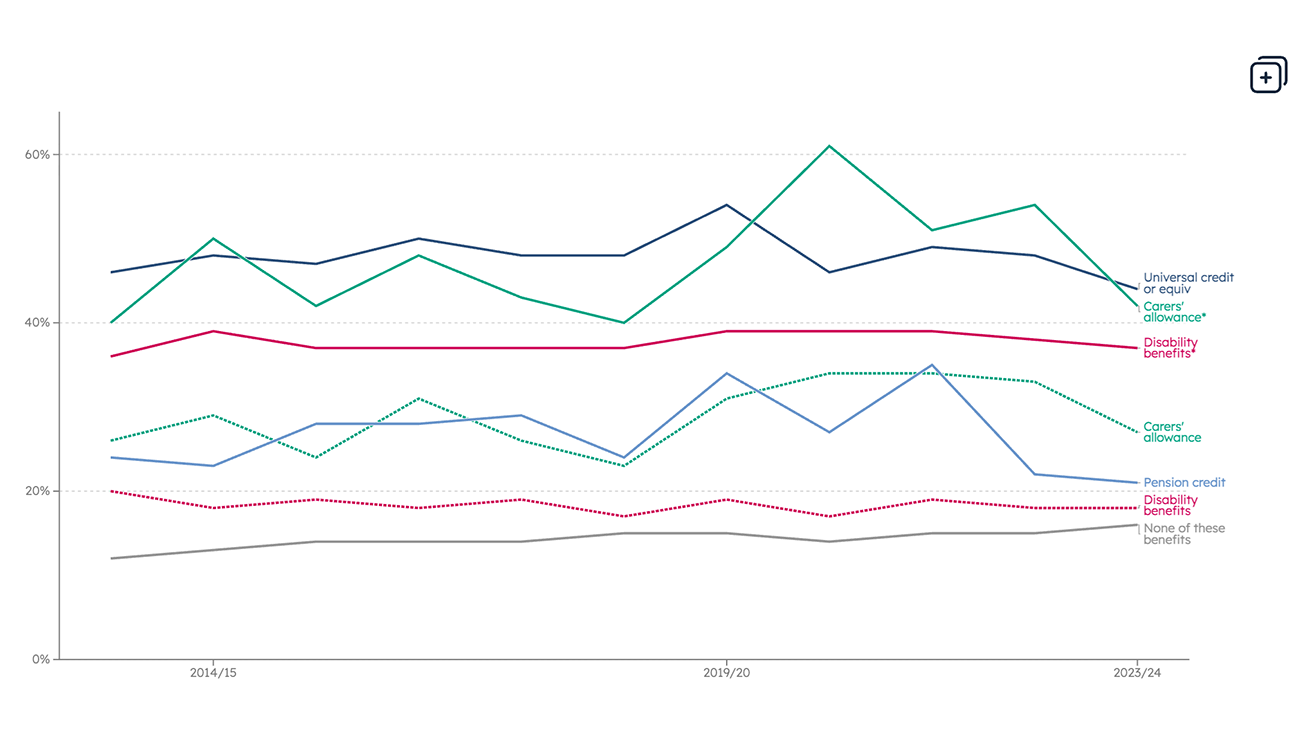
Data Social security Our latest data charts show people receiving social security face much higher poverty rates, reflecting inadequate benefit levels that fail to meet the cost of essentials.
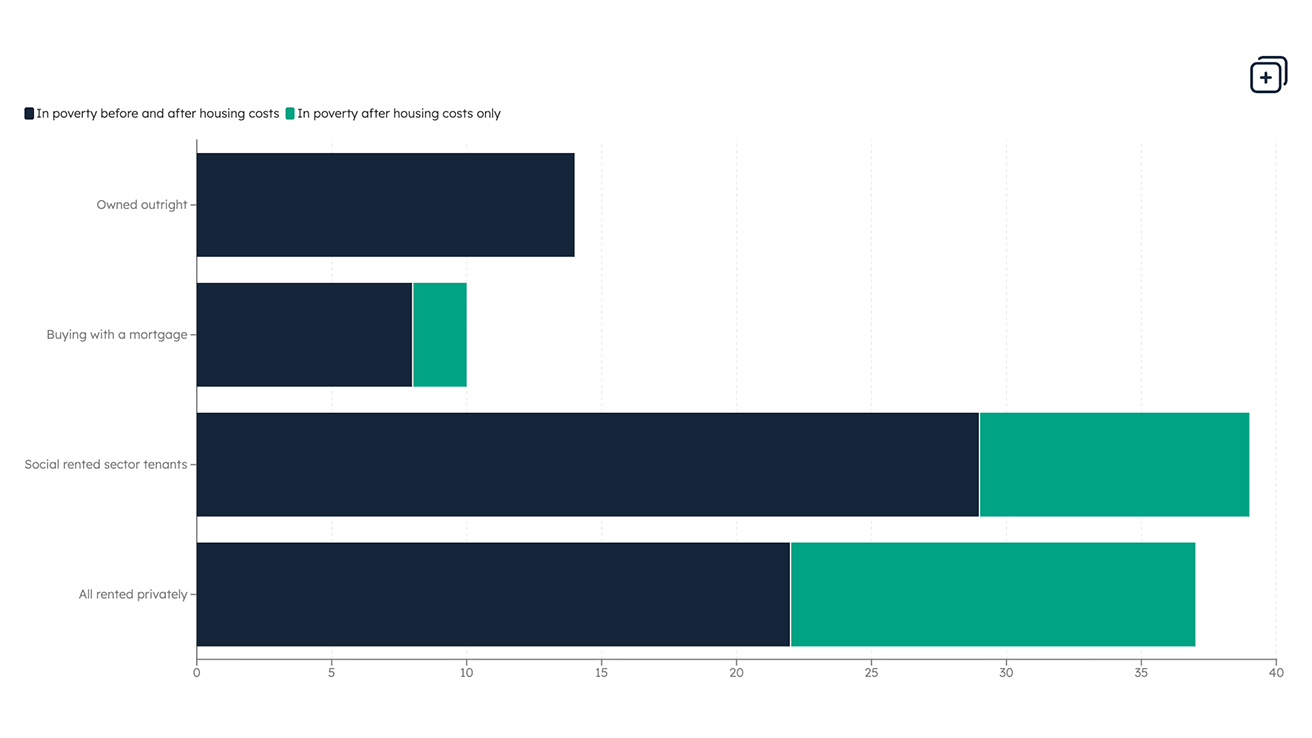
Data Housing Our latest data charts show poverty rates are highest among renters, with high housing costs pulling many private renters into poverty and low incomes driving poverty among social renters.
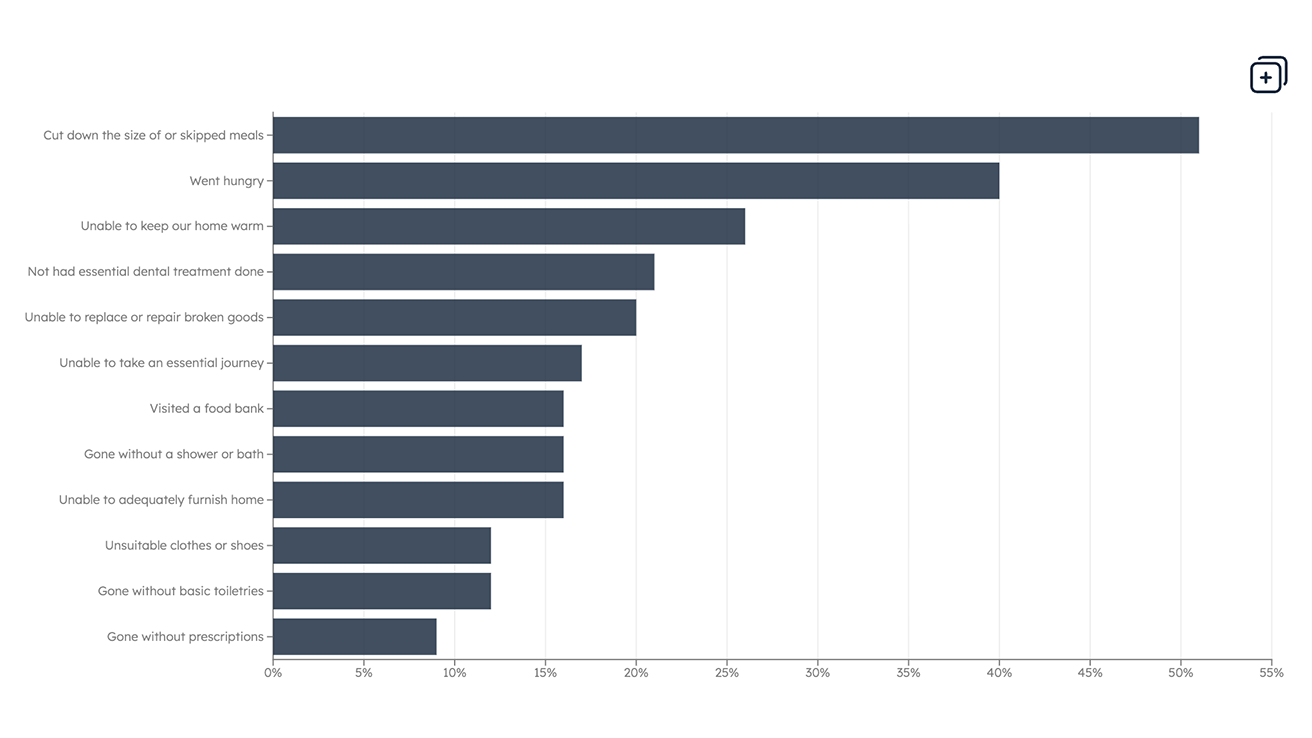
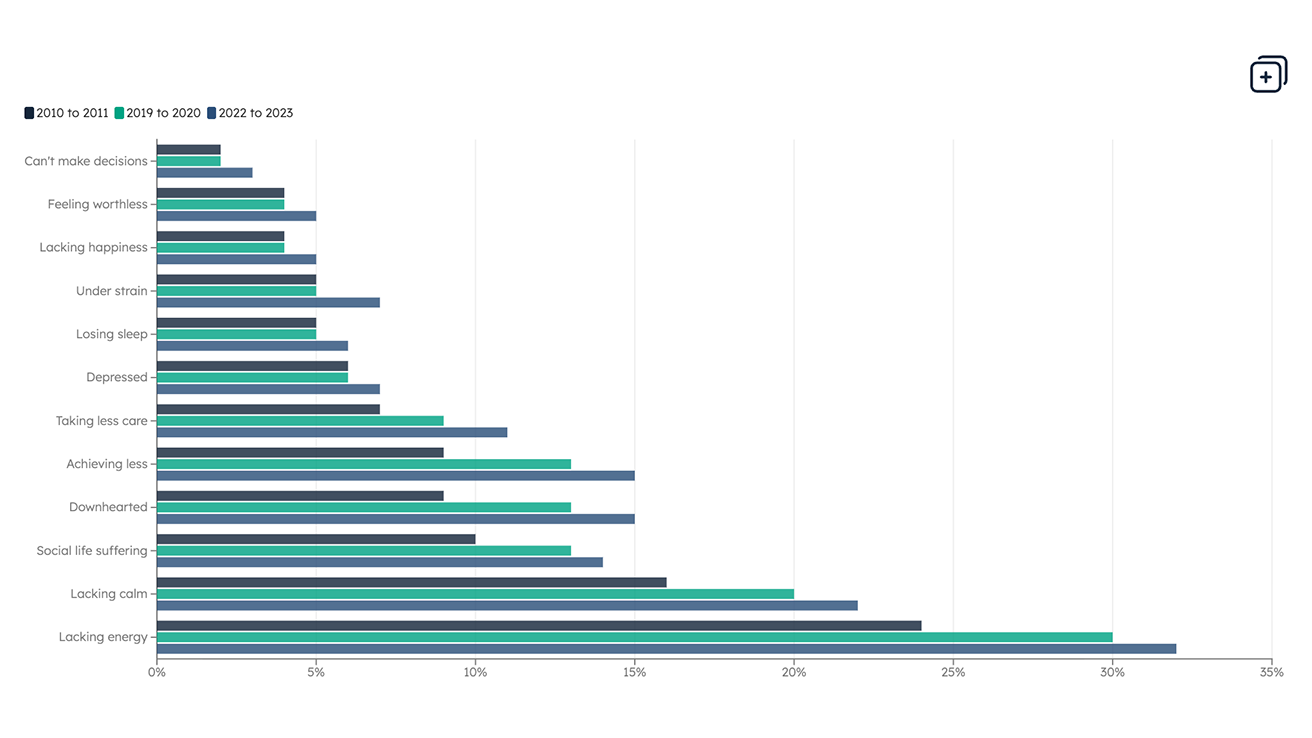
Data Cost of living Our latest data charts show low-income families continue to face severe hardship, often going without essentials such as food and heating, with lasting impacts on health and wellbeing.
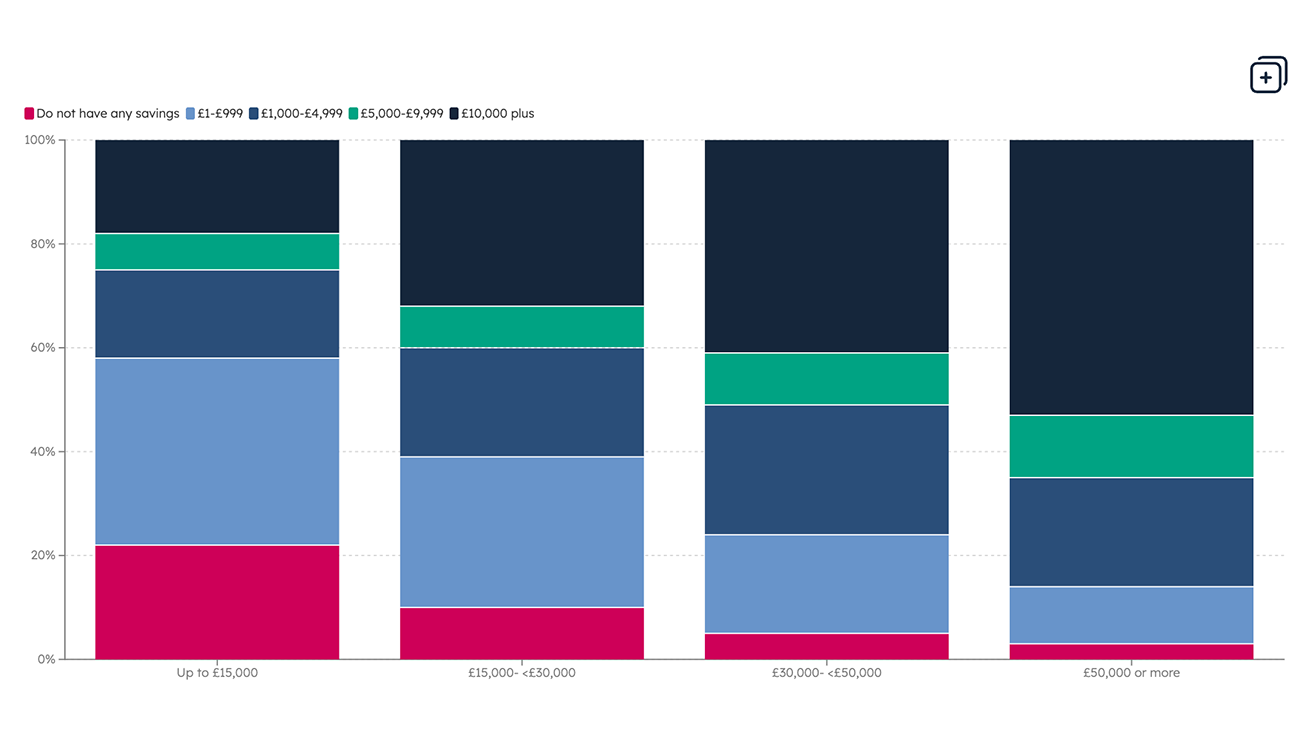
Data Savings and debt Our latest charts show low-income households are far more likely to hold little or no savings and face heavy debt burdens, increasing financial insecurity and hardship.
Data Food insecurity Our latest data charts show people in poverty struggle to afford enough food, particularly nutritious options needed for healthy diets. Children and lone-parent families are most affected.
Data Health Our latest data charts show working age adults in poverty are more likely to report poor health which gets worse with age and low-incomes are linked with higher rates of anxiety.
Data Education Our latest data shows substantial gaps in educational attainment still exist for children growing up in poverty, limiting opportunities later in life.