Monitoring poverty and social exclusion 2016 (MPSE)
This latest annual report from the New Policy Institute brings together the most recent data to present a comprehensive picture of poverty in the UK.
Key points
- In 2014/15, there were 13.5 million people living in low-income households, 21% of the UK population. This proportion has barely changed since 2002/03.
- The number of private renters in poverty has doubled over the last decade. There are now as many private renters in poverty as social renters. Rent accounts for at least a third of income for more than 70% of private renters in poverty.
- The number of households accepted as homeless and the number of households in temporary accommodation have both increased for five years in a row. Evictions by landlords are near a ten‑year high.
- The proportion of working-age adults in employment is at a record high. Full-time employees account for 62% of the growth in jobs since 2010. The proportion of young adults who are unemployed is the lowest since 2005.
- The number of people in poverty in a working family is 55% – a record high. Four-fifths of the adults in these families are themselves working, some 3.8 million workers. Those adults that are not working are predominantly looking after children.
- 1.4 million children are in long-term workless households, down 280,000 in four years. Excluding lone parent families with a child under five, 55% of these children have a disabled adult in their household.
- Once account is taken of the higher costs faced by those who are disabled, half of people living in poverty are either themselves disabled or are living with a disabled person in their household.
Poverty
In 2014/15, there were 13.5 million people in poverty in the UK, 21% of the population. This is not a large change from a decade earlier; in 2004/05 there were 12 million people in poverty, 21% of the population.
| 2004 / 05* | 2014 / 15* | |
|---|---|---|
| Children | 3.7 | 3.7 |
| 16-24 | 1.4 | 1.6 |
| 25-44 | 3.1 | 3.5 |
| 45-64 | 2.4 | 3 |
| 65+ | 1.9 | 1.5 |
| In working families | 5.4 | 7.4 |
| In workless or retired families | 6.7 | 6.1 |
| Social renting | 4.7 | 4.6 |
| Private renting | 2.2 | 4.5 |
| Owner-occupied | 5.1 | 4.5 |
*The data for poverty by age is a three-year average
There have been other changes, however. There are 400,000 fewer pensioners in poverty, despite there being around 1.7 million more people aged 65 or over. There are 2 million more people in working families in poverty, now up to 7.4 million, than a decade earlier. In contrast the number in workless or retired families in poverty fell by half a million.
Of those people in poverty, 45% are not in a working family. This 45% is made up of pensioners (12%); families with disabled members (17%); lone parent families (6%); and 11% in other circumstances, such as workless single adults.
People in poverty face reduced and falling financial resilience. For example, 69% of the poorest fifth have no savings whatsoever, an increase from 58% in 2005/06.
One aspect of poverty that can be understated in the official statistics is disability. When the extra costs of disability are partially accounted for, half of all people in poverty are either disabled, or in a household with a disabled person.
Housing
Figure 1: Private renters are much more likely to spend at least a third of their income on housing than households in another tenure with the same amount of income
Source: Households Below Average Incomes, DWP; the data is for 2014/15 for the UK
Failures in the housing market are a significant driver of poverty. This is primarily, but not entirely, due to costs. Housing costs are higher as a proportion of income for poorer households, and more so for renters. More than 70% of private renters in the poorest fifth spend at least a third of their income on housing, compared with under 50% in the social rented sector and 28% for those who own their own homes.
Experience of the housing market is increasingly determined by tenure. In 2010/11, the number of landlord evictions and mortgage repossessions were both around 23,000. In 2015/16, there were 37,000 landlord evictions and 3,300 mortgage repossessions. 58,000 households were accepted as homeless in 2015/16, an increase of almost 50% compared with five years earlier. The most common cause of homelessness is the end of a shorthold tenancy or rent arrears.
Households placed in temporary accommodation have also risen each year since 2011, though they remain below the levels of the mid-2000s. Three-quarters of those in temporary accommodation are from London.
Life Chances
The life chances policy area, which has been the subject of renewed interest in the last year, is mainly concerned with educational attainment and children in workless households. While the attainment gap at 16 between disadvantaged pupils and non-disadvantaged pupils has not changed in five years, there have been falls in the number of children in workless households.
Figure 2: 960,000 children in long-term workless households are in lone parent families while 630,000 are in households with at least one disabled adult
Source: Children Living in Workless Households, ONS; the data is for 2014 for the UK
Disability and family type are significant in explaining the children still in workless households; 46% of children in workless households have at least one disabled adult in the household, and 70% are in a lone parent household. A quarter are in disabled lone parent households.
The life chances agenda also needs to reflect the importance of income. Overall 29% of children are in poverty but the rate is much higher for some groups including: those in social or private rented accommodation (52% and 46% respectively); those of Pakistani and Bangladeshi or Black ethnicity (52% and 45% respectively); and those who have two foreign-born parents (45%). Of this last group 70% are estimated to have been born in the UK.
The focus on educational attainment also needs to take into account special educational needs, which is associated with both lower attainment and higher rates of school exclusion.
Social security
Increasingly the social security system does not cover the full cost of essentials for those on low incomes, such as rent and Council Tax. There are 690,000 families paying at least £200 more a year in Council Tax now than there were before Council Tax Benefit was abolished in 2013.
Figure 3: Following the reduction in the overall benefit cap, the government estimates that the number of families affected will rise from 20,000 to 112,000
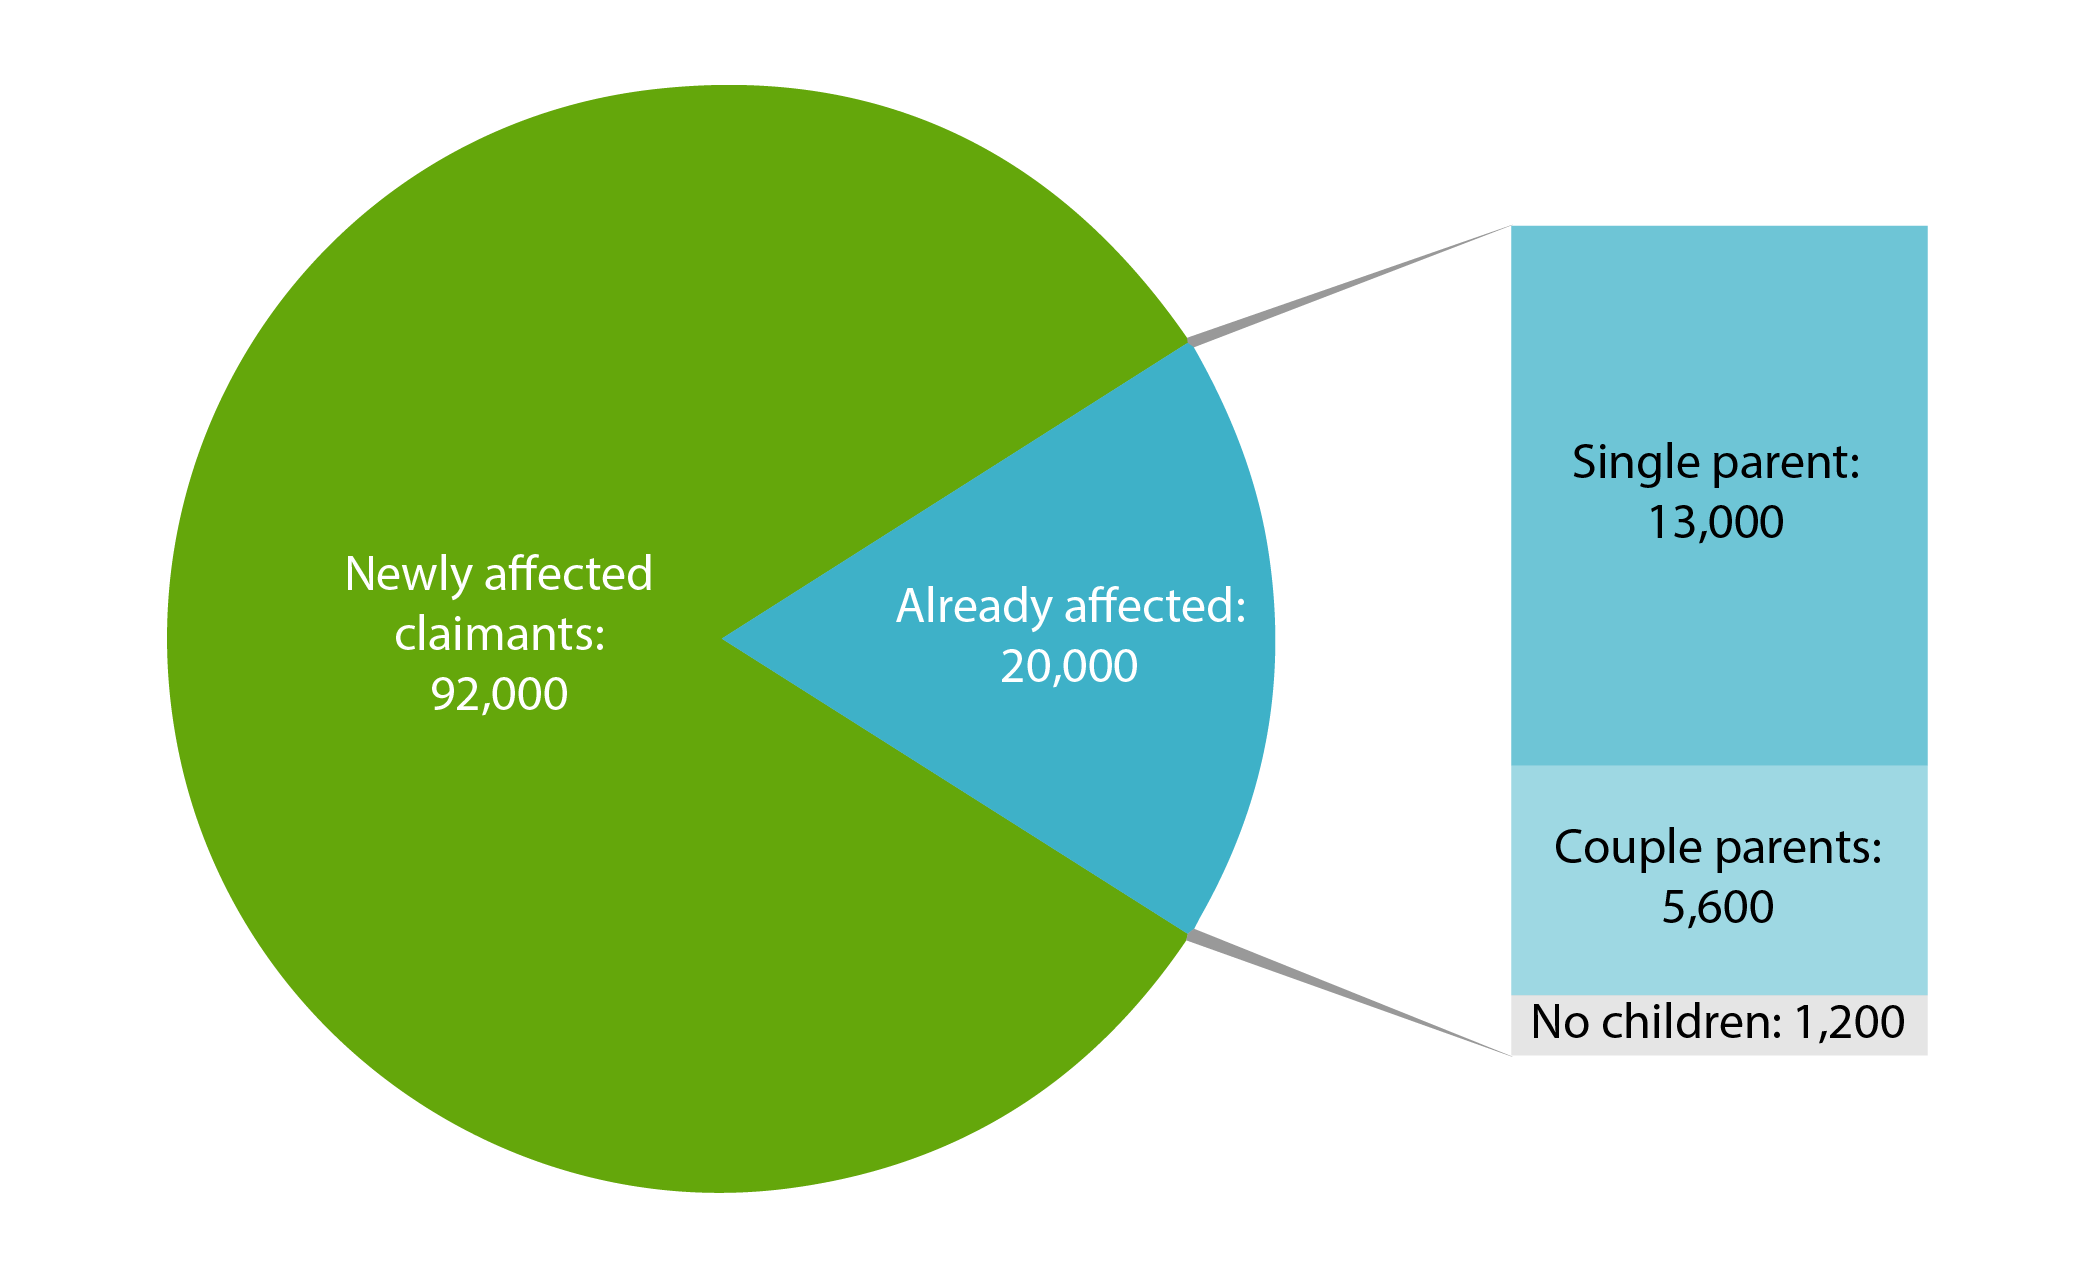
The overall benefit cap, which limits households’ annual income from benefits, mainly affects households with children. The lowering of the cap will increase the number of families affected, from 20,000 to 112,000. Those families currently affected by the cap will face further reductions in income of £50 or more a week.
Another change from April 2018 will affect adults aged 35 or under in the social rented sector, who will be eligible only for the lower ‘shared room rate’ for their accommodation, with rent shortfalls to be met from other income. Many of these adults are potentially vulnerable, with low incomes and histories of homelessness. There is, however, a planned exemption for those in sheltered accommodation.
The number of benefit sanctions has fallen. Compared with 2013/14, sanctions for Jobseeker’s Allowance have fallen from 734,000 to 204,000, while those for Employment and Support Allowance have fallen from 19,000 to 8,400.
Work and worklessness
The employment rate for working-age adults is at a record high. Of the additional employment since 2010, 62% has been in full-time employee jobs. Underemployment has fallen for the fourth consecutive year to five million. This is still above pre-recession levels, though the number of unemployed adults at 1.6 million is at its lowest since 2007. The proportion of young adults who are unemployed is now down to its lowest level since 2005, at 8.5%, but it is still nearly three times as high as for other working-age adults.
In contrast, male weekly earnings are still lower than 2005 levels once inflation is taken into account. Female weekly earnings are now equal to 2005 levels, but still below what they were in 2010.
Figure 4: There are 3.8 million workers in poverty; the largest group of workers in poverty are female employees
Source: Family Resources Survey, DWP; the data is for the UK
The strong labour market has coincided with an increase in the number of workers in poverty. There were 3.8 million workers who were in a household in poverty in 2014/15, up by around a million since 2004/05. In-work poverty is more common for younger workers, self-employed workers and part-time employees.
Conclusions
On many indicators, the UK economy has now recovered from the financial crisis and prolonged period of stagnation. If this recovery turns into a period of sustained growth, it is important that those on low incomes share in it and feel the gains. But we must also consider how the economy and the state can be restructured to prevent poverty in the first place. Great progress has been made reducing pensioner poverty, but progress on child poverty is at risk. Housing in the UK is too often expensive and of poor quality, particularly in the private rented sector. Work, although the best defence against low income, is too often insufficient. The social security system has become less effective for those with housing costs and Council Tax to pay. If these problems can be addressed, then many more people will share in the UK’s prosperity.
About the project
Monitoring poverty and social exclusion is a regular, independent assessment of progress in tackling poverty and other types of disadvantage across the UK.
The report uses official data from a range of sources to look at trends and patterns across different indicators. Different indicators reveal different patterns, allowing us to get a better understanding of the contemporary nature of poverty and exclusion. This year’s key themes are income, housing, life chances, social security and work and worklessness. This report is the nineteenth in the series. It is a valuable resource for researchers and policy-makers alike. By looking at recent trends, it aims to better illuminate the challenges of tackling poverty in the coming years.